Bitcoin price inches closer to $30K after Inflation data
Bitcoin price analysis: In the previous month, after the US Bureau of Labor Statistics published data about CPI inflation on July 12, the price of Bitcoin went up by 4%, reaching a new highest point for 2023 at $31,500. We’re now wondering if a similar pattern will occur this month. To understand this, let’s examine the underlying factors of Bitcoin.
Recent days have shown a surge in momentum for Bitcoin, with double-digit growth in on-chain transactions over the last four days.
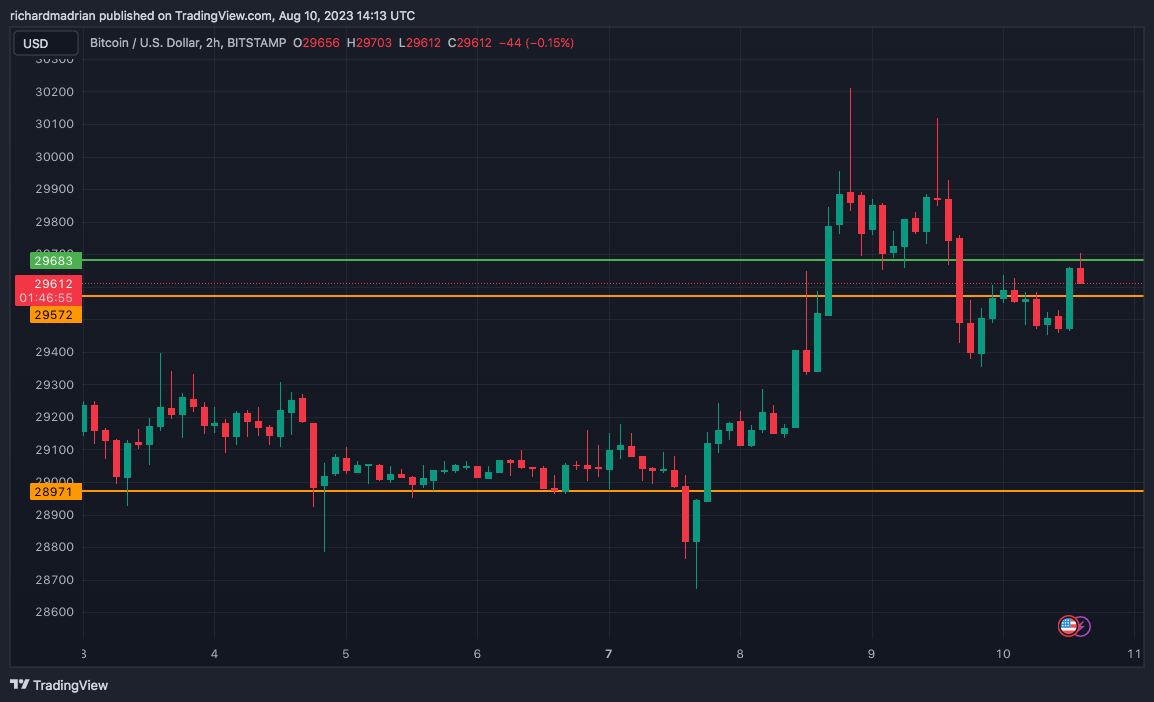
Looking back at history, we can see that Bitcoin has often experienced a rally when the market anticipates a decrease in CPI or a cautious increase. For instance, the CPI data released on July 12 indicated that inflation had only risen by a mild 1% in the prior month. In response, the price of Bitcoin had increased by 5% during the week leading up to the CPI release and then experienced an additional 4% surge after the release. This propelled it to a new peak for 2023. A similar trend seems to be occurring this week. With the new CPI data available today, the Bitcoin price has come closer to the $30,000 mark.
Bitcoin ( BTC/USD ) price data from on-chain sources suggests that cryptocurrency traders are preparing for another round of positive price movement in anticipation of the current release of inflation data.
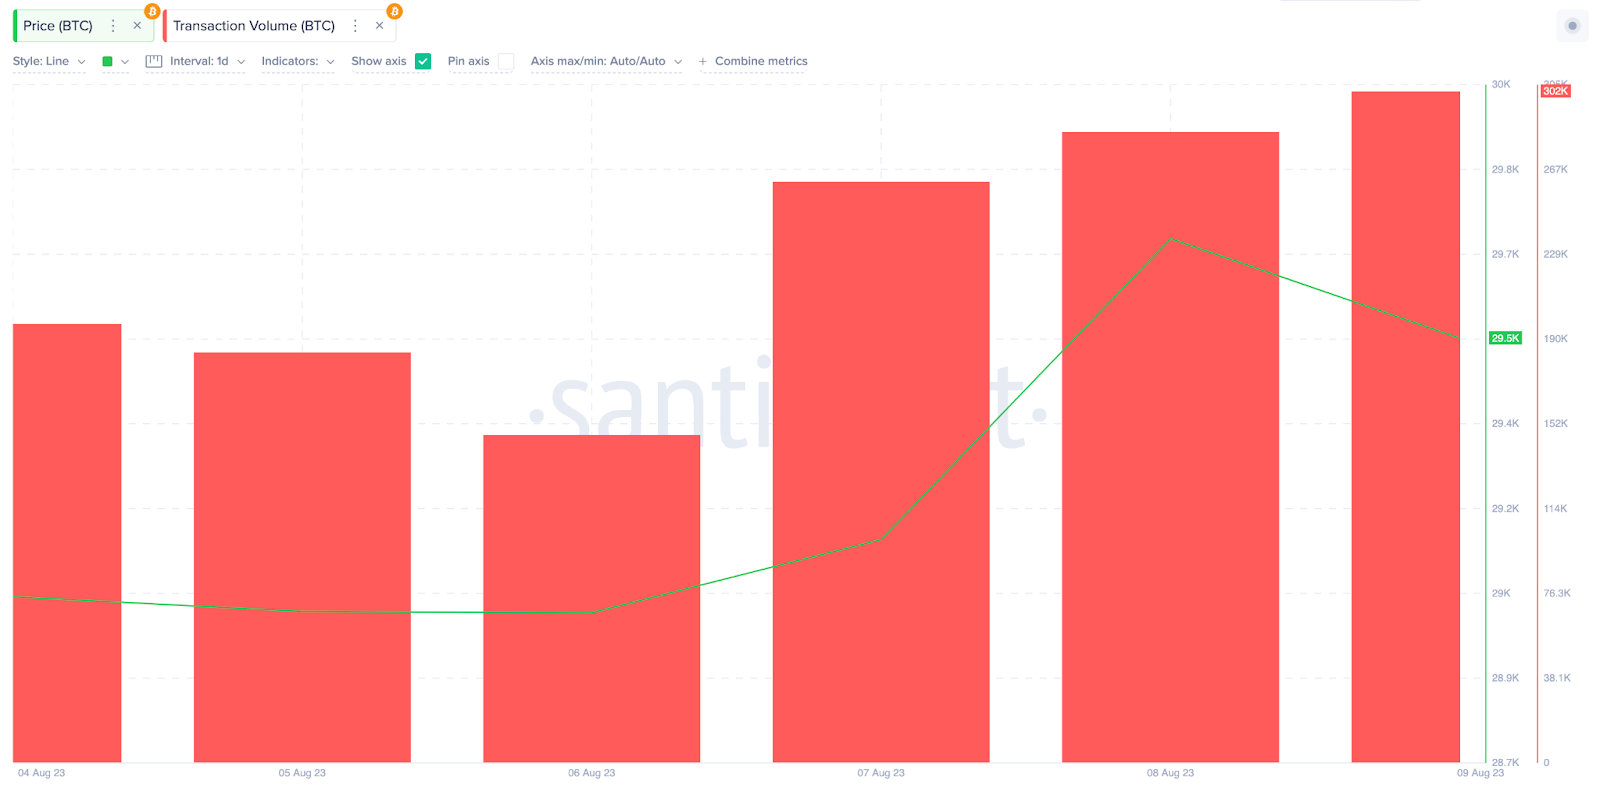
According to the on-chain data, the volume of Bitcoin transactions denominated in BTC has been progressively increasing for four consecutive trading days. As shown in the chart below, the BTC Transaction Volume on August 6 was 147,670 transactions. By the end of August 9, it had rapidly risen to 302,500 transactions. This represents an impressive 104% surge in trading activity ahead of the August 10 CPI inflation data release.
The technical analysis of Bitcoin’s price indicators and oscillators presents a mixed outlook. The indicators lean towards a predominantly bullish sentiment, with 19 indicators signaling a buy, 10 neutral, and 3 indicating a sell. Similarly, the oscillators are relatively positive, with 2 indicators suggesting a buy, 9 neutral, and none indicating a sell. Moving averages show a slightly bullish trend, with 1 buy, 1 neutral, and 3 sell signals. The Relative Strength Index (RSI) stands at a neutral 53, indicating a balanced market momentum. The Moving Average Convergence Divergence (MACD) displays a strong bullish signal at -72, implying potential upward momentum. Overall, while there is some mixed sentiment, the MACD and RSI suggest a potential bullish trajectory for Bitcoin’s price in the near term.
Considering these factors, it appears that there is a mixed sentiment in the market with both bullish and neutral indicators. While historical patterns and recent transaction volume suggest potential positive movement, it’s important to keep an eye on the upcoming CPI inflation data release and its impact on Bitcoin’s price.
- Check out our free forex signals
- Follow the top economic events on FX Leaders economic calendar
- Trade better, discover more Forex Trading Strategies
- Open a FREE Trading Account
- Read our latest reviews on: Avatrade, Exness, HFM and XM
Related Articles

Sidebar rates
Related Posts
