Bitcoin Struggles to Break Above $30K: Technical Analysis and Market Outlook

BTC/USD technical analysis: Introduction
The Bitcoin market continues to face significant challenges as it struggles to breach the crucial $30,000 psychological level. In this technical analysis, we will examine the current price dynamics and various indicators to gain insights into the cryptocurrency’s potential direction.
Price and Resistance Levels
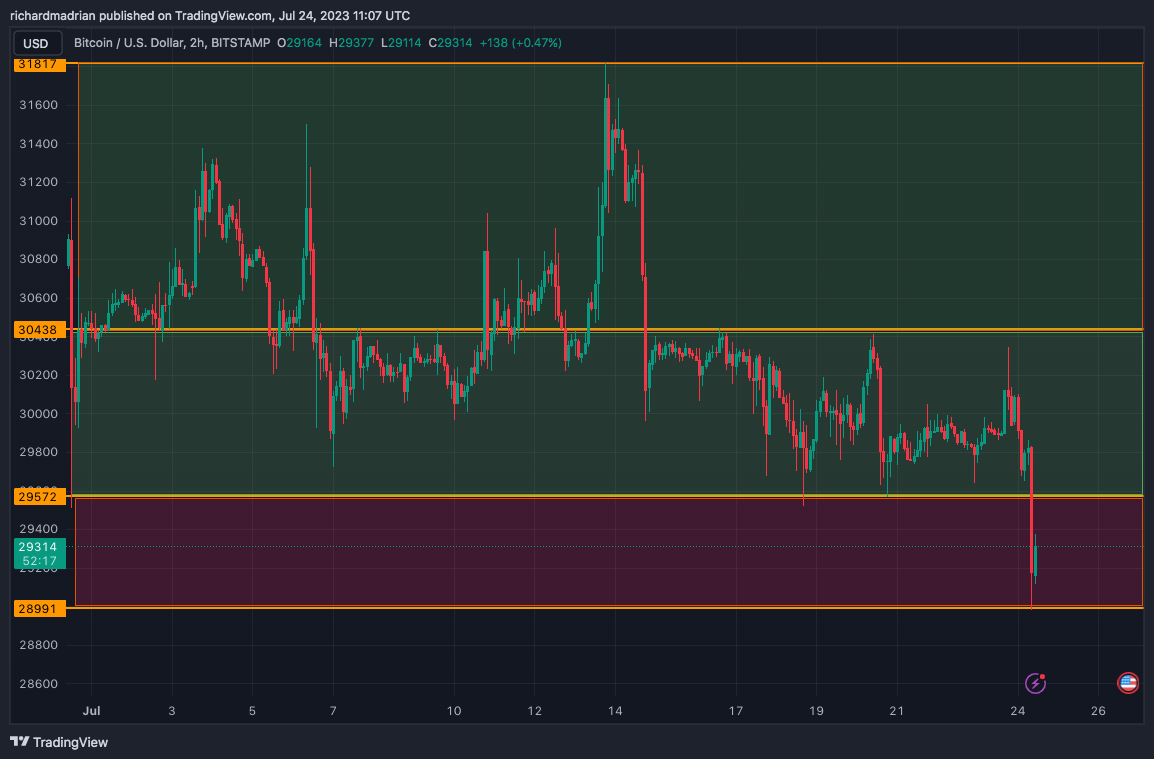
At the time of writing, Bitcoin is trading at $29,301, hovering near the 100-day Exponential Moving Average (EMA). The overhead resistance at $31,000 has proven to be formidable, forcing the bulls to consolidate momentum and attempt to overcome rejection. However, buyers have not yet established stronger support at $29,500, indicating the presence of bearish pressure.
The bearish region on the chart lies between $28,991 and $29,499. A crucial turning point for Bitcoin’s short-term trend lies in the possibility of the bulls securing support above this region. Should they achieve this, a rebound above $30,000 becomes feasible, with the potential to break through the resistance at $31,000 by the end of the week.
Short-Term Charts
On the 1-hour chart, the buyers are gradually closing in on breaking the 50-day Exponential Moving Average, which currently stands at $29,379. If the price successfully surpasses this level, the pair is likely to recover support at $29,500, leaving only one remaining hurdle at $29,818 to clear the path for a strong upside move towards $31,000.
Bitcoin technical analysis: Downside Risks
However, if the bulls fail to sustain a strong upside movement, the price could experience a downward spiral. In such a scenario, the key support level to watch is the 50-day Simple Moving Average (SMA) at $29,002. A drop below this level might signal the resurgence of bearish sentiment, with the pair potentially collapsing below the 200-day Exponential Moving Average at $26,000.
BTC/USD technical analysis: Indicator Evaluation
Meanwhile, let’s analyze the indicators to gauge the sentiment and potential direction of Bitcoin’s price:
- The MACD (Moving Average Convergence Divergence) stands at 65, indicating a bullish momentum in the market.
- The Relative Strength Index (RSI) is currently at 43, suggesting that the market is neither significantly overbought nor oversold.
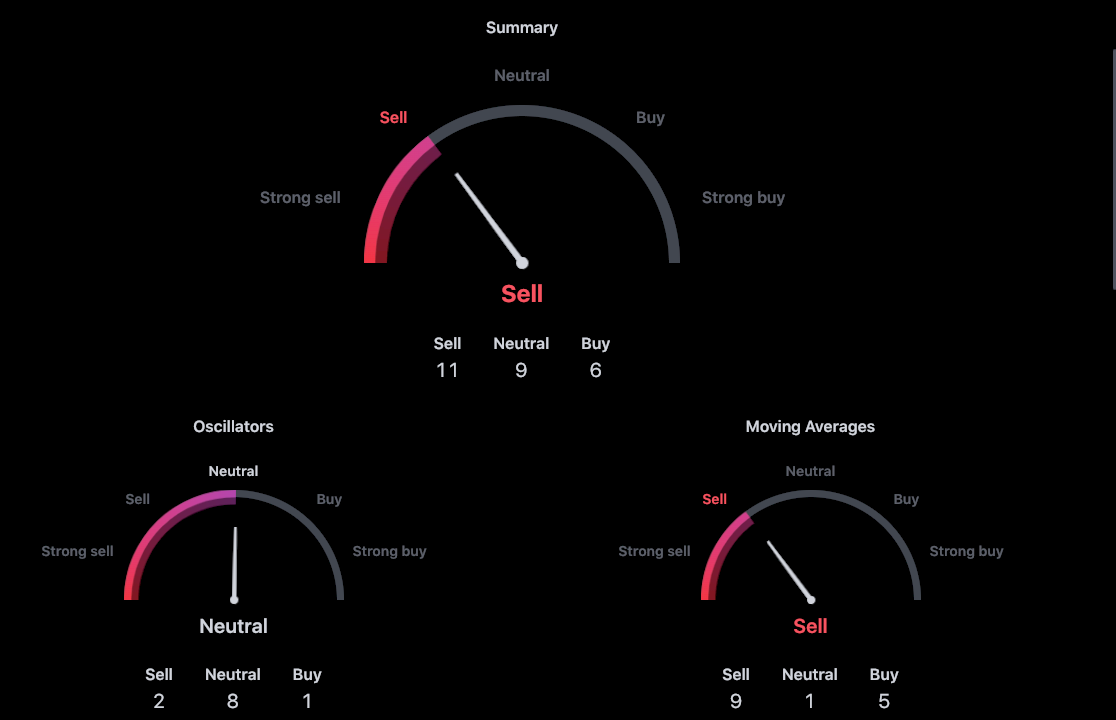
- In terms of indicators’ signals, 11 are selling, 9 are neutral, and 6 are buying. Additionally, the oscillators show 2 sell signals, 8 neutral signals, and 1 buy signal. Meanwhile, the moving averages display 9 sell signals, 1 neutral signal, and 5 buy signals.

BTC/USD technical analysis
BTC/USD technical analysis: Conclusion
In conclusion, Bitcoin’s struggle to break above $30,000 has brought both challenges and opportunities for traders. The current price dynamics and indicators signal the importance of key support and resistance levels, particularly at $29,500 and $31,000. If the bulls manage to establish firm support above $29,499; the cryptocurrency may experience a rebound and potentially surge beyond $31,000 in the near future.
However, traders must remain vigilant, as a failure to sustain upward momentum could lead to a downward trend, with the risk of Bitcoin dropping below critical support levels. As always, market participants should exercise caution and utilize technical analysis alongside other factors to make informed decisions in this highly volatile cryptocurrency market.
- Check out our free forex signals
- Follow the top economic events on FX Leaders economic calendar
- Trade better, discover more Forex Trading Strategies
- Open a FREE Trading Account
- Read our latest reviews on: Avatrade, Exness, HFM and XM
Related Articles
Sidebar rates
Related Posts
