Bitcoin Traders Unfazed by Strong PCE Data: Examining the $28K Price Range
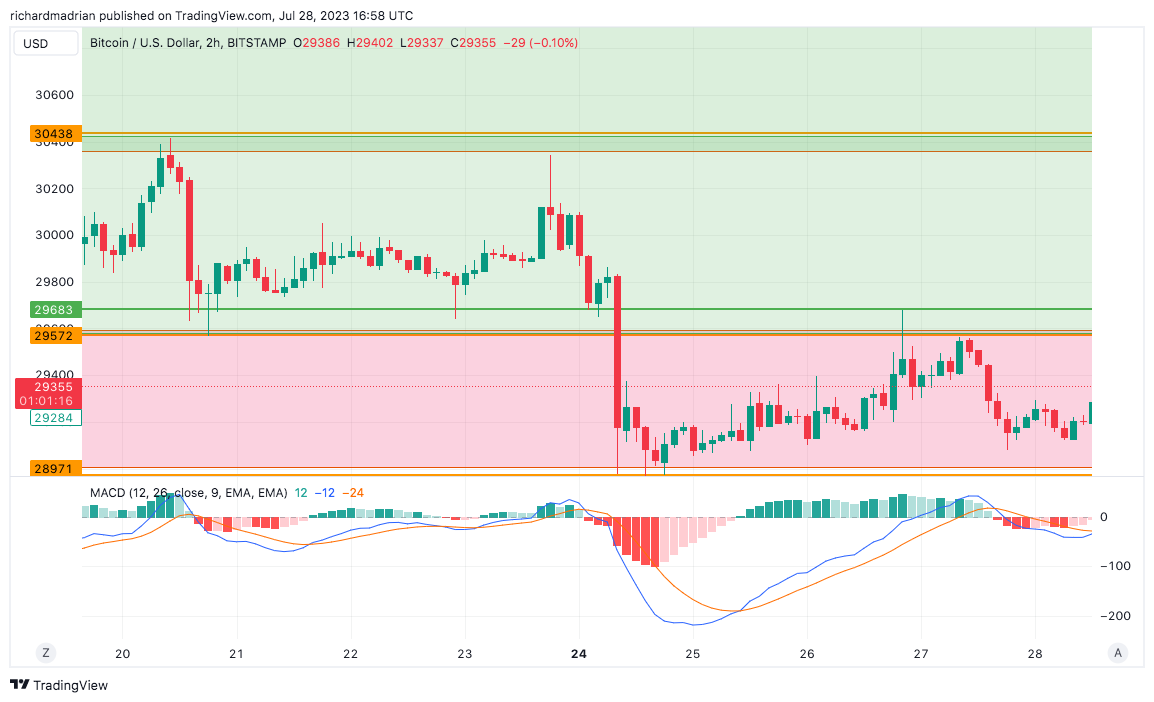
[[BTC/USD]], the popular cryptocurrency pair, is currently trading at $29,368, showing a slight bearish bias in the market sentiment. The main support level for the asset has been identified at $28,970, a critical price level that has historically acted as a strong foundation for BTC’s price movements.
At present, the Relative Strength Index (RSI) for BTC/USD stands at 45. This value indicates that the selling pressure is prevailing over buying pressure in the market. However, it is important to note that the RSI is still above the oversold threshold of 30, which suggests that the market has not reached an extreme bearish condition. Traders should closely monitor the RSI to assess any potential shifts in momentum.
One of the key technical indicators used in this analysis is the Moving Average Convergence Divergence (MACD). Currently, the MACD for BTC/USD is recorded at -104. This significant negative value of the MACD line indicates that the short-term moving average is substantially lower than the long-term moving average. This bearish crossover suggests that there is a potential downtrend forming in the BTC/USD pair.
In the short term, the immediate hurdle for BTC/USD is at $29,863. If the price manages to surpass this level, it could signal a potential reversal in the short-term bearish trend. However, given the current market conditions, the bulls might face considerable resistance at this hurdle, making it a critical level to watch closely.
Bearish traders are eyeing the $28,000 price level as their target. If the bears successfully breach the main support level at $28,970, it could trigger further selling pressure, potentially pushing the price lower towards the $28,000 mark. On the other hand, for the bulls to regain control, they must defend the support level and aim to break above the immediate hurdle.
A comprehensive analysis of various technical indicators can provide deeper insights into market sentiment. The analysis considers nine sell signals, nine neutral signals, and eight buy signals from various indicators. The mixed signals suggest that the market sentiment is currently uncertain and indecisive, with no clear dominant trend. Traders should exercise caution and wait for a clearer picture before making significant trading decisions.
Additionally, the analysis of oscillators is also essential to gauge market momentum. Currently, the oscillators show one sell signal, eight neutral signals, and two buy signals. Similar to the indicators, the oscillators’ mixed signals indicate that traders are adopting a wait-and-see approach, possibly awaiting further market developments before committing to a specific direction.
Moving averages are crucial indicators that offer valuable insights into the overall trend. In this analysis, eight sell signals, one neutral signal, and six buy signals are observed. The multiple sell signals reflect the presence of bearish pressure, but the conflicting signals from other indicators highlight the market’s current state of uncertainty.
In conclusion, BTC/USD is experiencing a slight bearish bias, with the main support level at $28,970 and an immediate hurdle at $29,863. The RSI and MACD both indicate a bearish sentiment, while the mixed signals from various indicators and oscillators suggest a state of indecision in the market. Traders and investors should closely monitor these key levels and indicators to make informed decisions, as the cryptocurrency market can be highly dynamic and subject to sudden shifts in sentiment.
BTC/USD Daily Analysis Chart
- Check out our free forex signals
- Follow the top economic events on FX Leaders economic calendar
- Trade better, discover more Forex Trading Strategies
- Open a FREE Trading Account
- Read our latest reviews on: Avatrade, Exness, HFM and XM
Related Articles


Sidebar rates
Related Posts
