Silver Climbs to $78–$80 Range as US-Iran Diplomatic Hopes Ease Geopolitical Pressure – Breakout Above $80 in Focus?
Silver (XAG/USD) is hovering in the $78- $80 per ounce range on April 16, 2026, showing a volatile but distinct upward trend since...
Quick overview
- Silver (XAG/USD) is currently trading between $78 and $80 per ounce, showing a significant recovery from earlier lows.
- The recent surge in silver prices, including a 7% increase on April 14, is attributed to easing geopolitical tensions and a weakening US dollar.
- Silver is expected to face a sixth consecutive year of supply deficit in 2026, driven by strong industrial demand.
- Technical analysis indicates that silver is testing key resistance levels, with potential buy signals above $80.
Silver (XAG/USD) is hovering in the $78- $80 per ounce range on April 16, 2026, showing a volatile but distinct upward trend since the last exchange. On April 15, it briefly touched the $78.63-$80.62 mark ( depending on timing), making a notable recovery from the earlier week’s low.
What’s Been Happening Lately
Silver had a pretty impressive run up on April 14, managing to surge by over 7% and closing near $79.61 per ounce. After dropping to near the $60-$70 zone way back in March, prices have been slowly making their way back up, but are still a long way from the $117-$121 all-time high of early January 2026.
The gold to silver ratio has been looking a bit out of balance lately (around 61-63.7 as of now), hinting that gold has been doing a better job of weathering the current geopolitical uncertainty.
What’s Driving Prices Today
- Iran -US Diplomatic Optimism: All that talk about negotiations getting back underway in Pakistan has taken some of the edge off the geopolitical worries, causing the US dollar to soften & precious metals to benefit. Notably, President Trump suggested Iran is eager to make a deal, which has helped ease inflation fears stemming from the ongoing blockade & Strait of Hormuz restrictions.
- Big Picture Factors: The US dollar has been taking a bit of a beating in the last few sessions, which is certainly helping, & lower oil prices (after some diplomatic breakthroughs) have also helped take some of the heat off. Though the situation is still pretty fluid.
- Fundamentals: Silver prices are looking at a sixth year in a row of deficit in 2026 (~67 million ounces forecast). The industrial demand for silver (solar, EVs, electronics, & technologies related to AI too) remains strong & shop shelves have been a bit bare of stock lately, providing some valuable support. April 15 saw the World Silver Survey 2026 get released, which gave us a fresh take on supply & demand balances.
Silver Technical Analysis Breakdown
On the 4 hour chart, silver is now moving through a key Fibonacci zone between $72.10 and $75.50 that it had earlier consolidated in, and has now broken through to test the $78- $80 resistance area. Price is holding its own right above that ascending trendline from late March, where we’ve seen higher lows form.
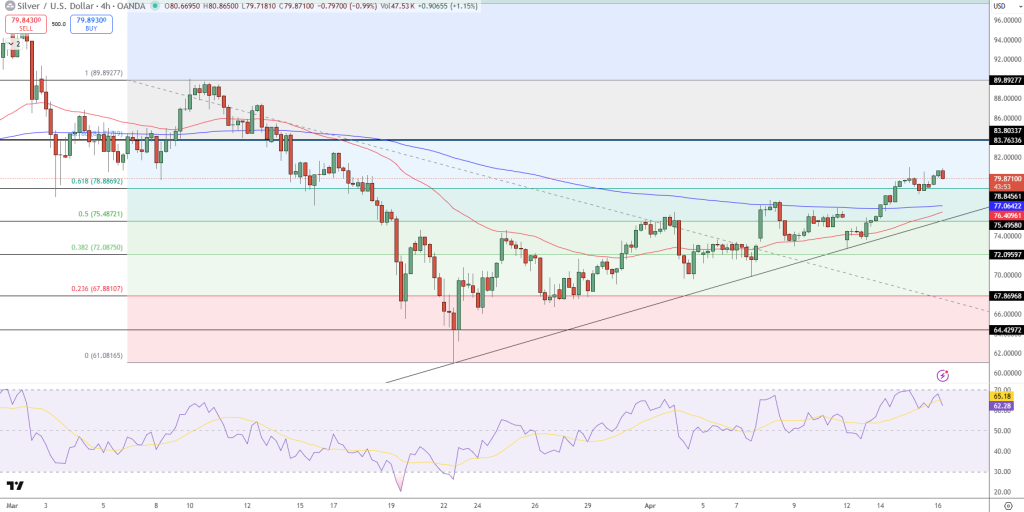
The 50 day EMA is finally starting to turn & flatten up a bit, suggesting that momentum is picking up, and the 200 day EMA at $76.80 has been recaptured, reinforcing the bull case.
Key Levels To Watch:
- Resistance: $80.00 → $83.80 → $89.90
- Support: $78.00 → $75.50 → $72.10
Trade Idea: Buy above $80, targeting the $83.80-$89.90 zone, and look to get out below $78.
- Check out our free forex signals
- Follow the top economic events on FX Leaders economic calendar
- Trade better, discover more Forex Trading Strategies
- Open a FREE Trading Account
- Read our latest reviews on: Avatrade, Exness, HFM and XM
Related Articles


Sidebar rates
Related Posts
