Silver Holds $78.70–$79.20 as US-Iran Diplomatic Hopes Support Precious Metals – Breakout Above $80 in Focus?
Silver spot (XAG/USD) is trading in a $78.70 to $79.20 range per ounce on April 17, 2026, showing a modest little upswing...
Quick overview
- Silver spot (XAG/USD) is trading within a range of $78.70 to $79.20 per ounce, showing a modest upswing of about 0.4 to 0.8% on April 17, 2026.
- The metal has experienced a consistent rise over the past four weeks, with a nearly 30% increase since March 2026 lows, although it remains below its all-time high of $117 to $121 from January 2026.
- Market dynamics are influenced by US-Iran diplomatic tensions, with expectations of a silver deficit in 2026 and strong industrial demand supporting prices.
- Technical analysis indicates a bullish structure for silver, with key resistance at $80-$81 and support levels between $77.00 and $75.50.
Silver spot (XAG/USD) is trading in a $78.70 to $79.20 range per ounce on April 17, 2026, showing a modest little upswing of about 0.4 to 0.8% throughout the day & staying steady in the aftermath of recent wild fluctuations.
Recent Price Action
Silver’s had a pretty consistent run of four weeks in a row where it’s been going up , with gains of roughly 4% this week alone & nearly a 30% jump since its March 2026 lows. It all kicked off mid-week with some sessions showing gains of over 7% – briefly testing the $80-$81 mark before pulling back to the $78-$79 zone.
Its still nowhere near the $117 to $121 all-time high back in January 2026 but its definitely made a pretty good recovery from those dips earlier this year.
Today’s Market Drivers
Silver’s pretty much moving in tandem with gold & the overall risk sentiment here, which is heavily influenced by the ongoing US-Iran diplomatic thing. Markets are hanging out for some clear signs of a second round of talks or a ceasefire extension, which could help ease some of those geopolitical tensions, reduce the risk of oil driven inflation & make a softer US dollar more likely – all things that usually help precious metals out.
- By all accounts , hopes of a de-escalation & safe passage through the Strait of Hormuz have taken the edge off some of the risk premiums – which is contributing to that steady tone in silver today despite the odd wobble.
- Industrail demand for silver ( around 50-60% of total usage including solar, EVs, electronics & all sorts of other high tech applications) brings its own unique factor into play. Any sign of sustained global growth recovery or electrification trends will be supporting silver in the long term – even if that’s tempered by short-term worries about energy security.
Some other key factors right now include:
- The US dollar’s been feeling a bit softer in some pockets & mixed signals are coming from central banks.
- Markets are expecting a pretty significant deficit in silver for 2026, with buyers getting in on the physical action & inflows from ETFs and investment money helping to keep prices afloat.
- There’s also a good bit of technical consolidation going on around the $79 mark, with some observers noting that short positions are at historically lower levels.
Broader Context
Silver’s basically just been following gold’s lead , showing even bigger percentages swings in response to headlines on US-Iran negotiations, oil prices & dollar movements. And it’s been pretty resilient overall, even in the face of all these choppy geopolitics.
Longer-term analysts are pretty optimistic overall – with J.P. Morgan tipping an average of $81/oz for 2026, and other forecasts going for $90-$100+ by the end of the year or into 2030 if the deficit tightens up & industrial demand really starts to kick in – let alone the wildest forecasts which are calling for much higher levels.
Technical Analysis
Silver (XAG/USD) is trading in a steady bullish structure just now , after bouncing back from some pretty low levels. Its still holding above that rising trendline near $77.00-$77.80, which acts as a base for buyers – and this area also happens to line up with the short-term moving averages, making it a pretty big deal.
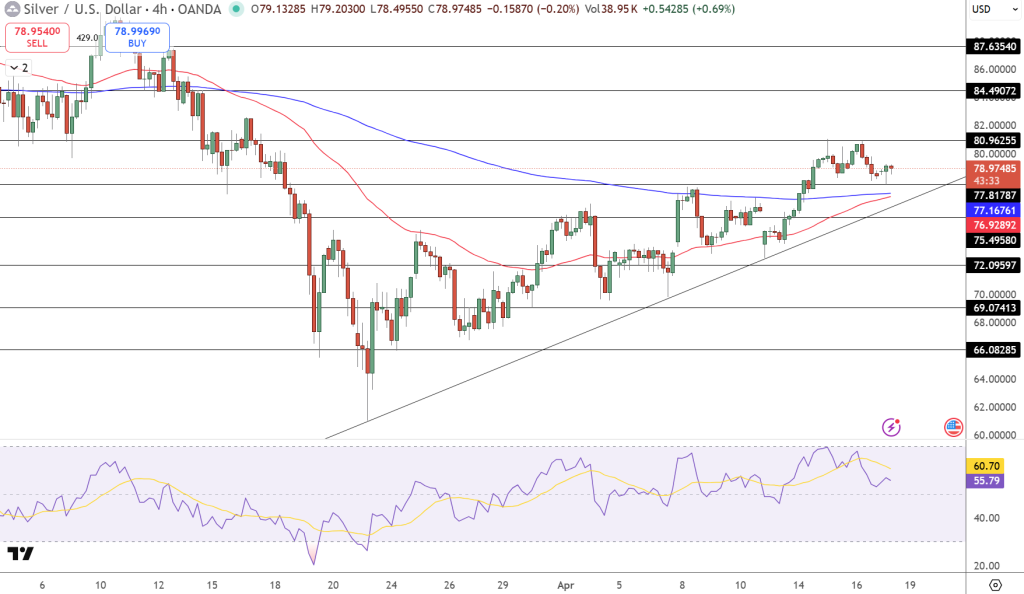
If it wants to break above $80-$81 resistance though, it’s going to need to get past that zone first – which it did try & failed to do recently, so we might see some profit taking going on.
The Relative Strength Index (RSI) is currently sitting at around 55-60, which is saying that its got some moderate momentum going but its not getting too carried away.
Key Levels :
- Resistance: $80.00 to $82.00
- Support: $77.00 to $75.50 to $72.00
Trade Idea : Buy above $80 targeting $82-$83.80, but get out if the price hits $77.00.
- Check out our free forex signals
- Follow the top economic events on FX Leaders economic calendar
- Trade better, discover more Forex Trading Strategies
- Open a FREE Trading Account
- Read our latest reviews on: Avatrade, Exness, HFM and XM
Related Articles


Sidebar rates
Related Posts
