USD/JPY Nudges Higher to 150.505; Eyes on US New Home Sales
In the current trading environment, the USD/JPY pair has exhibited a slight increase, registering a modest 0.01% gain to reach 150.505.
In the current trading environment, the USD/JPY pair has exhibited a slight increase, registering a modest 0.01% gain to reach 150.505. This incremental movement underscores a cautious optimism in the market, positioning the currency duo at a notable juncture for potential shifts in trading dynamics.
Market Activity Overview
Last week’s economic indicators provided mixed signals, with Japan’s Flash Manufacturing Purchasing Managers’ Index (PMI) slightly underperforming expectations at 47.2 against a forecasted 48.0.
Conversely, the Services Producer Price Index (SPPI) aligned with projections, marking a 2.4% year-over-year increase.
In the U.S., the manufacturing sector showed resilience, as evidenced by a Flash Manufacturing PMI of 51.5, surpassing the anticipated 50.7.
Service sector activity also exceeded expectations, with the Flash Services PMI reaching 52.5, suggesting a robust demand in the services economy. However, Existing Home Sales slightly dipped to 3.88 million, reflecting the ongoing challenges in the housing market.
Upcoming Economic Events
Attention now shifts to forthcoming economic releases that are poised to influence the USD/JPY trajectory. Notably, the U.S. New Home Sales data, projected at 680K, will offer insights into the housing market’s health and consumer confidence levels.
Meanwhile, Japan’s National Core Consumer Price Index (CPI) year-over-year is expected to rise to 2.3%, potentially signaling heightened inflationary pressures within the economy.
USD/JPY Price Forecast: Technical Outlook
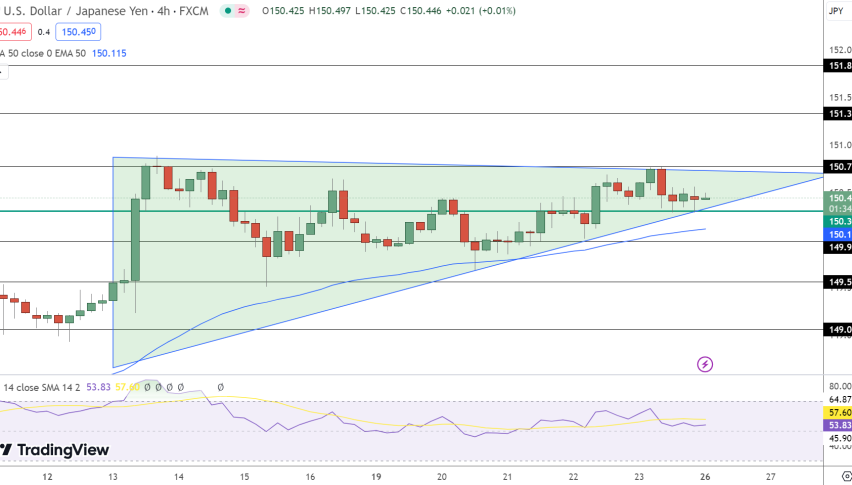
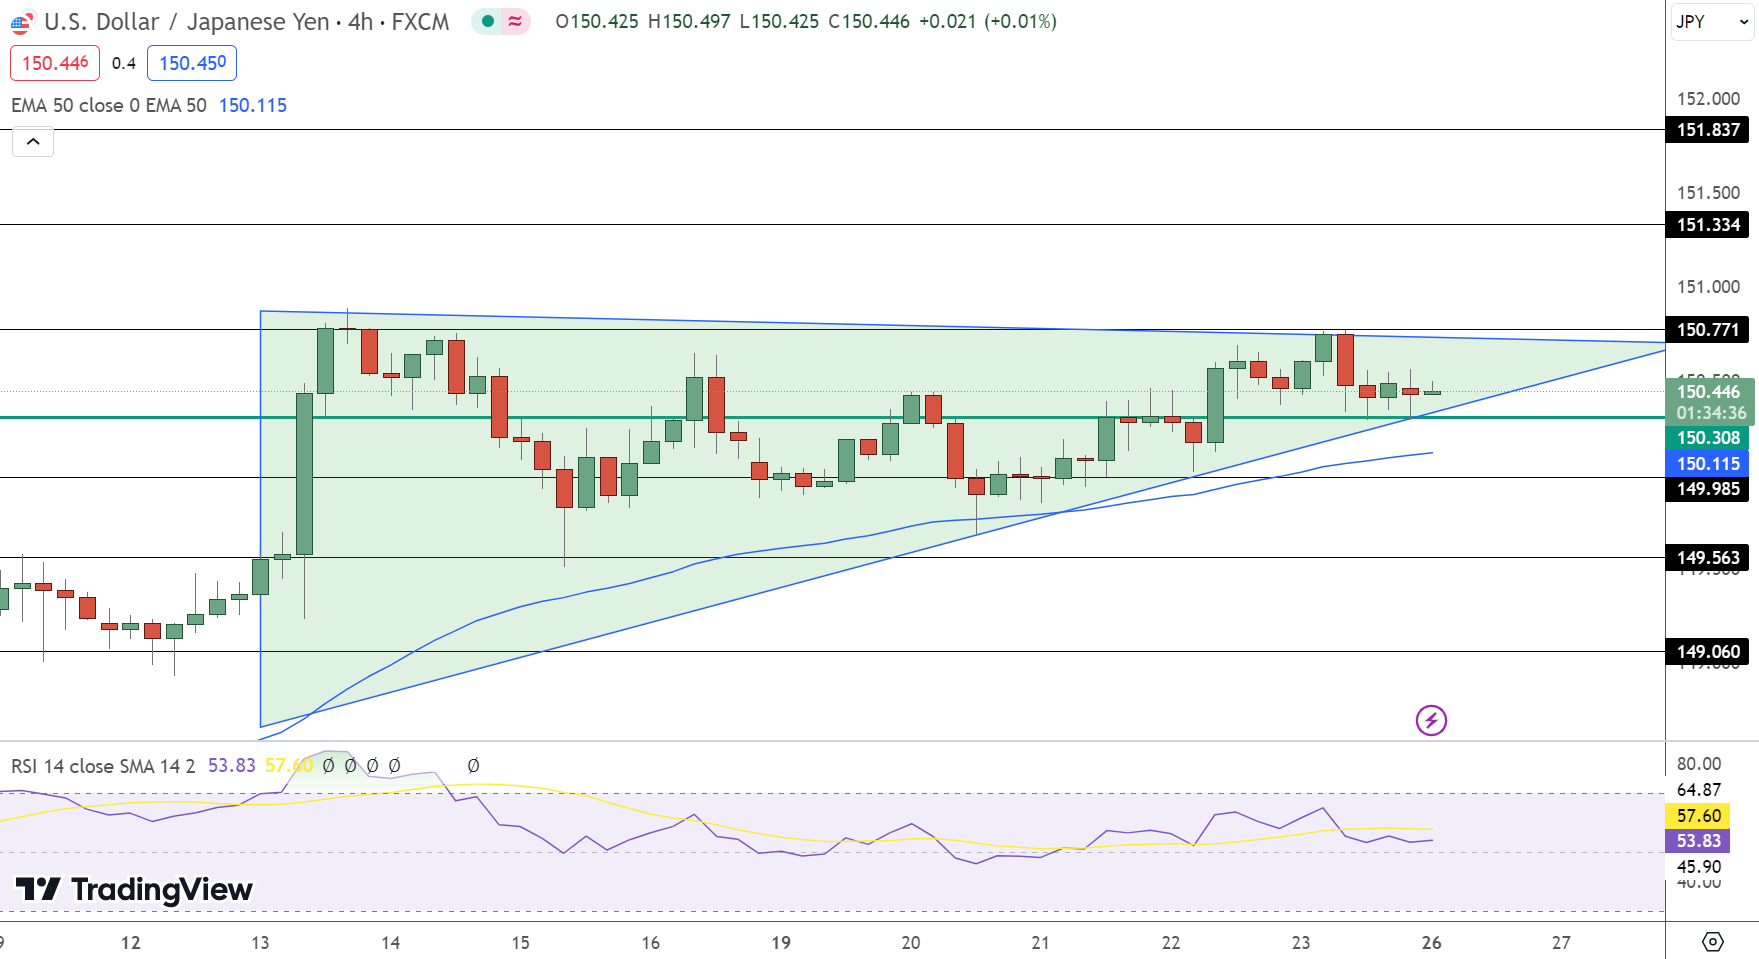
In Monday’s trading session, the USD/JPY pair showed marginal gains, nudging up 0.01% to trade around the 150.505 mark. This subtle movement places the currency pair at a critical juncture as it hovers just above its pivot point at 150.308.
Looking ahead, traders are eyeing resistance levels at 150.771, 151.334, and 151.837, which could cap upward movements. On the downside, immediate support is found at 149.985, with further cushions at 149.563 and 149.060 potentially stabilizing declines.
The Relative Strength Index (RSI) at 53 suggests neutral market momentum, while the currency pairs dance around the 50-day Exponential Moving Average (EMA) of 150.115, which indicates potential volatility.
- Check out our free forex signals
- Follow the top economic events on FX Leaders economic calendar
- Trade better, discover more Forex Trading Strategies
- Open a FREE Trading Account
- Read our latest reviews on: Avatrade, Exness, HFM and XM
Related Articles


Sidebar rates
Related Posts
