Bitcoin Soars Past $54,000: A Perfect Storm of Factors
Bitcoin (BTC) has experienced a significant surge, reaching a high of $54,938 on Monday, driven by a confluence of positive developments.
Bitcoin (BTC) has experienced a significant surge, reaching a high of $54,938 on Monday, driven by a confluence of positive developments. Here’s a breakdown of the key factors contributing to this rally:
1. Rising Popularity of Spot Bitcoin ETFs
Trading volumes for the “new nine” spot Bitcoin exchange-traded funds (ETFs) reached a new daily record of $2.4 billion on February 26th, surpassing the previous high of $2.2 billion set in January. This surge in activity suggests growing institutional interest in gaining exposure to Bitcoin through regulated investment vehicles.
BlackRock’s iShares Bitcoin Trust (IBIT) and Fidelity’s Wise Origin Bitcoin Trust (FBTC) were major contributors to the volume, attracting significant investment.
2. Increasing Bitcoin Mining Difficulty
Bitcoin mining difficulty, an indicator of network security and competition among miners, reached a record high of 81.73 trillion on February 16th. This rise demonstrates the increasing computational power dedicated to securing the Bitcoin network, potentially signaling investor confidence in its long-term viability. With the upcoming Bitcoin halving in April, which cuts mining rewards in half, this growing difficulty could further restrict supply and bolster the price.
3. Continued Institutional Inflows
According to CoinShares, institutional investment products saw inflows of $598 million into Bitcoin products over the past week. This marks the fourth consecutive week of positive inflows, highlighting the sustained interest from institutional players. Year-to-date inflows into spot Bitcoin ETFs have already surpassed $5.7 billion, indicating a growing appetite for direct Bitcoin exposure.
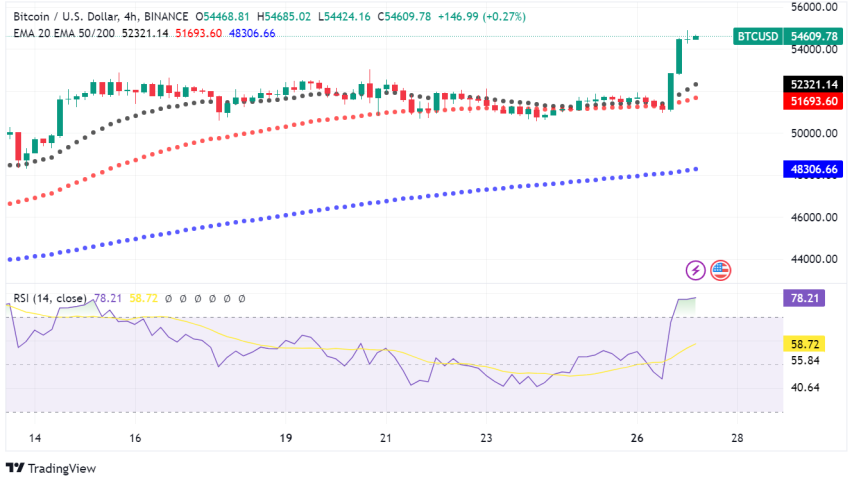
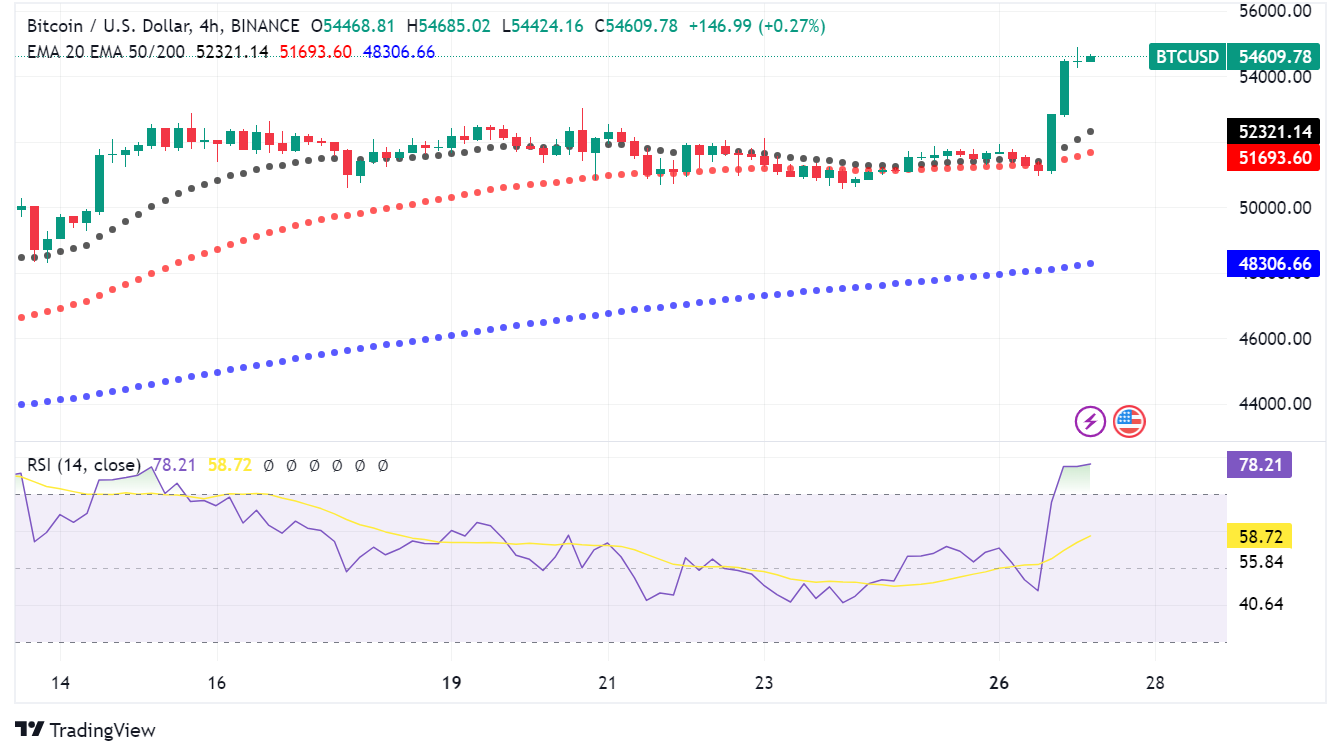
BTC/USD Technical Analysis
Following the breakout above $50,000, Bitcoin faces resistance at the $55,000 level. A sustained break above this level could pave the way for a further test of the $60,000 mark.
However, if the price fails to hold above $50,000, it could encounter support near the $48,000-$49,000 zone. Traders should monitor key technical indicators like the Relative Strength Index (RSI) and Moving Average Convergence Divergence (MACD) for potential buying and selling signals.
- Check out our free forex signals
- Follow the top economic events on FX Leaders economic calendar
- Trade better, discover more Forex Trading Strategies
- Open a FREE Trading Account
- Read our latest reviews on: Avatrade, Exness, HFM and XM
Related Articles


Sidebar rates
Related Posts
