BTCUSD. New all-time high or imminent drop?
BTC price has surpassed $60,000 for the first time in over 2 years. Bitcoin last traded above $60,000 in November 2021, shortly after hittin
What is happening in the markets?
BTC price has surpassed $60,000 for the first time in over 2 years. Bitcoin last traded above $60,000 in November 2021, shortly after hitting its all-time high, falling more than 67% to a low of $19,297 in early April 2022.
Now we ask ourselves the following question: Is a setback imminent prior to the halving?
The world’s first cryptocurrency is up more than 13% on the weekly chart and 37% over the last month. Bitcoin’s price performance can largely be attributed to market anticipation around the upcoming halving event, which historically leads to increased buying activity.
Main reasons behind the increase
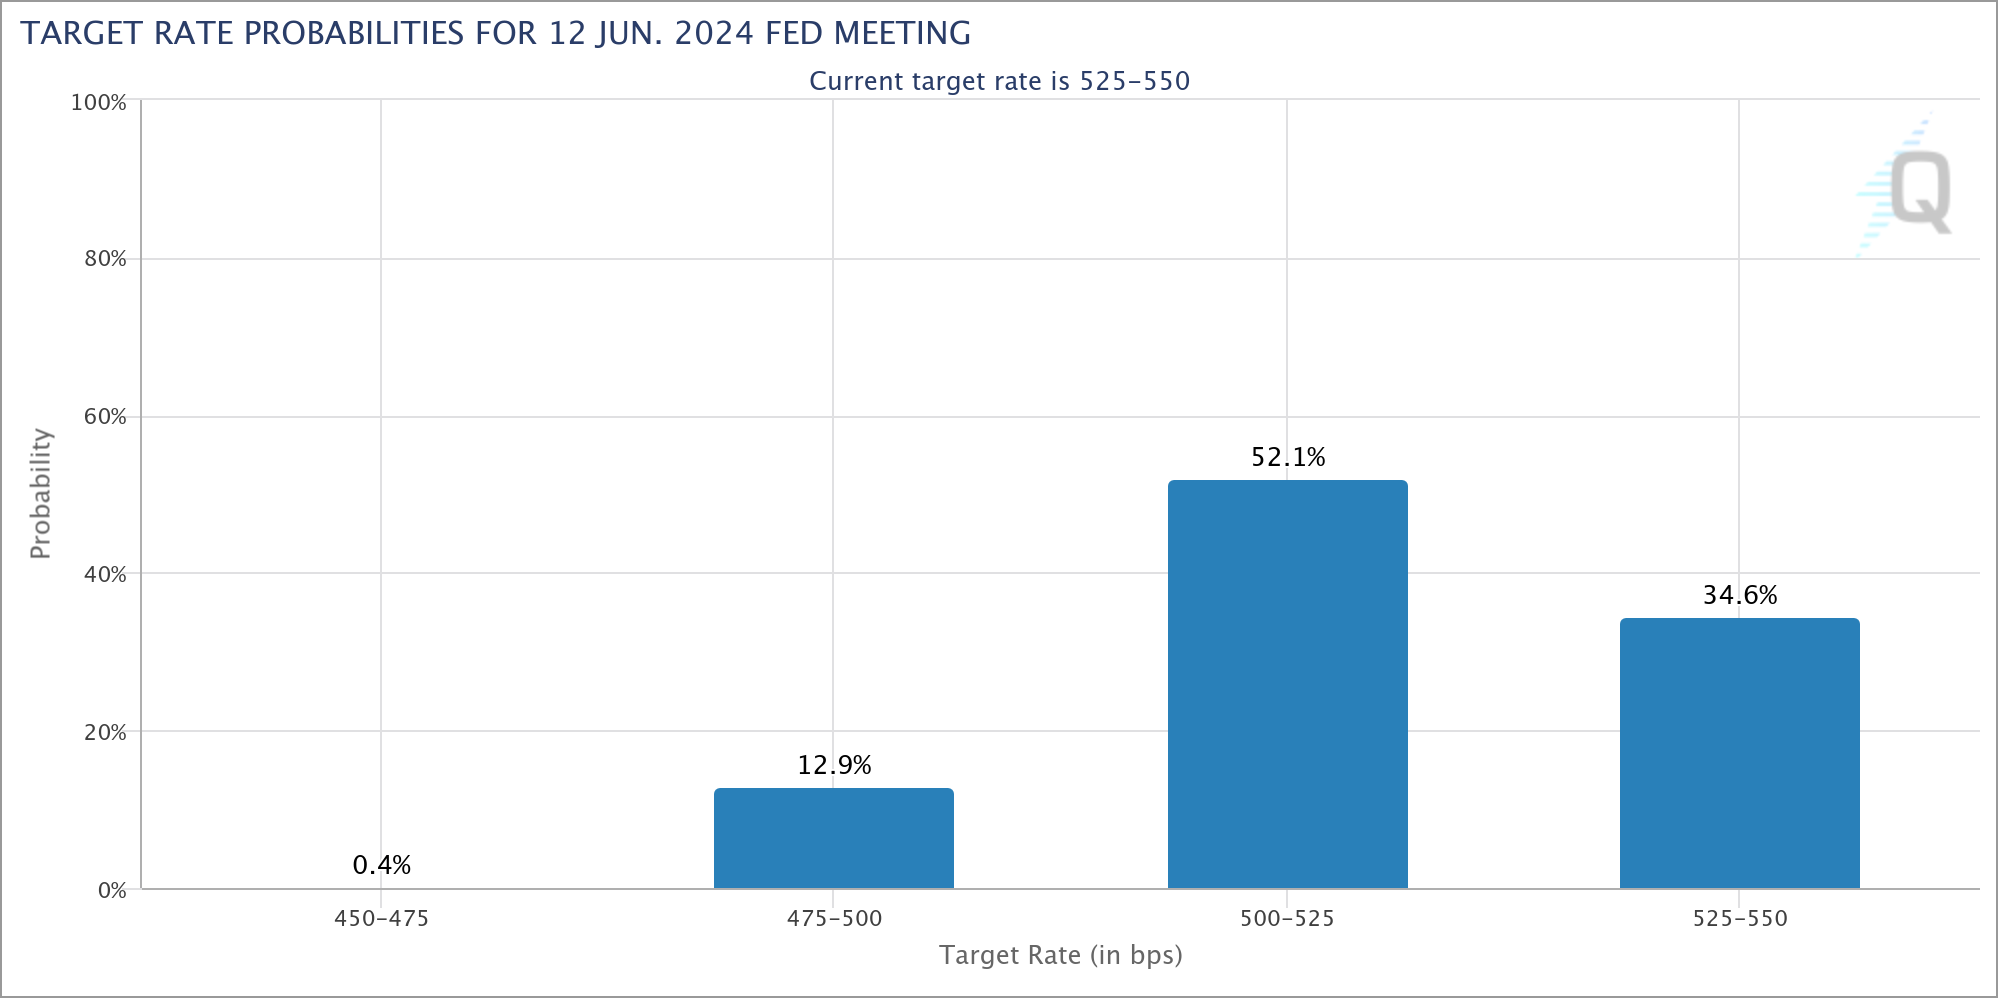
Although this growth is not solely attributable to the halving, the price increase has been driven by fundamentals such as increased demand from institutional investors following the launch of Bitcoin exchange-traded funds, as well as the possibility of interest rate cuts by the Federal Reserve this year, and, as we have mentioned, the halving scheduled for April of this year.
Usually, investors tend to expect that a reduction in supply will drive prices up. This is better known as the “pre-halving rally,” which contributes to a new bull market with renewed bullish sentiment, although we could not rule out a pre-halving pullback.
Bitcoin’s bullish momentum came a few days after Bitcoin ETFs broke an all-time high of $2.4 billion in daily trading volume on February 26. The nine Bitcoin spot ETFs have recorded combined trading volumes of over $2 billion for the second day in a row on February 28. Spot bitcoin ETFs already accumulate around 300,000 BTC.
The BTC holdings of the nine bitcoin ETFs represent around 1.5% of the total supply of 21 million BTC. Amid growing demand with limited supply, the price of BTC reached a new yearly high, and at the time of writing, Bitcoin is about 10% below its all-time high of almost $69,000.
It is worth mentioning that the cryptocurrency market has more than doubled in recent months, led by the rise of bitcoin. The total cryptocurrency market capitalization has regained the level of $2 trillion for the first time since April 2022, due to positive market sentiment and consistent inflows into bitcoin ETFs, which have driven prices higher.
To put it in perspective, the cryptocurrency market is now about $33 billion larger than Amazon and $42 billion larger than Alphabet, Google’s parent company.
Technical Overview
We have already analyzed the trends from a fundamental point of view, explaining the causes of price movement. Let us now analyze the BTCUSD price chart.
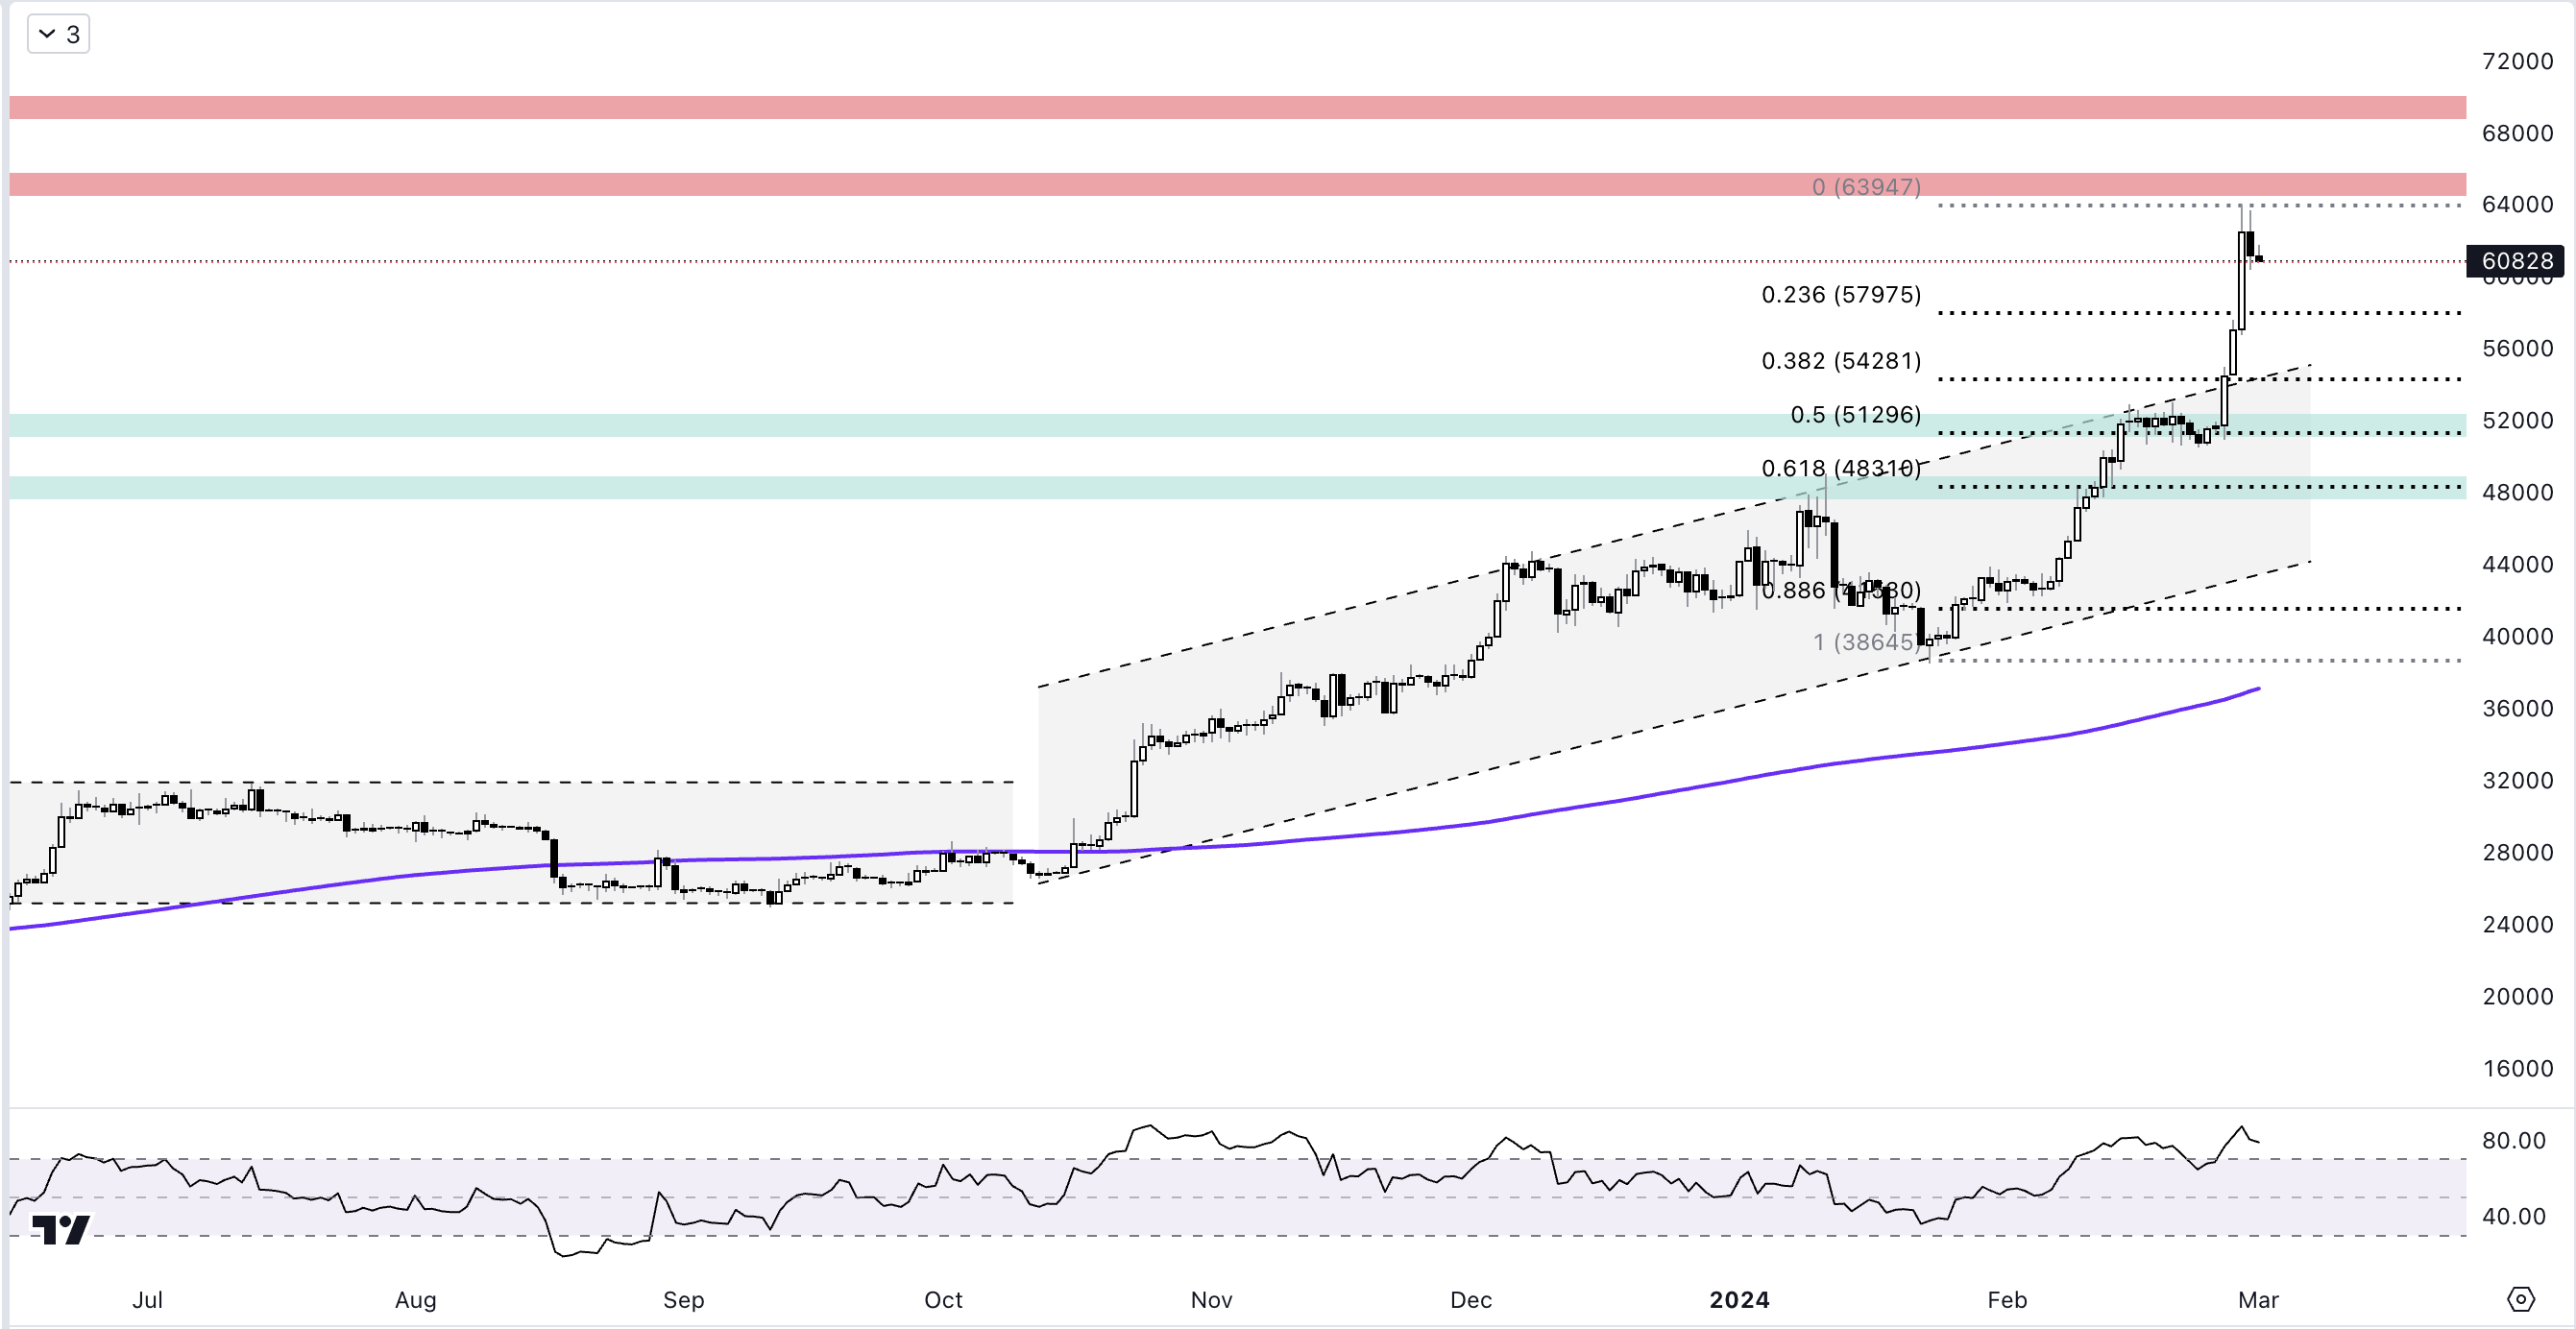
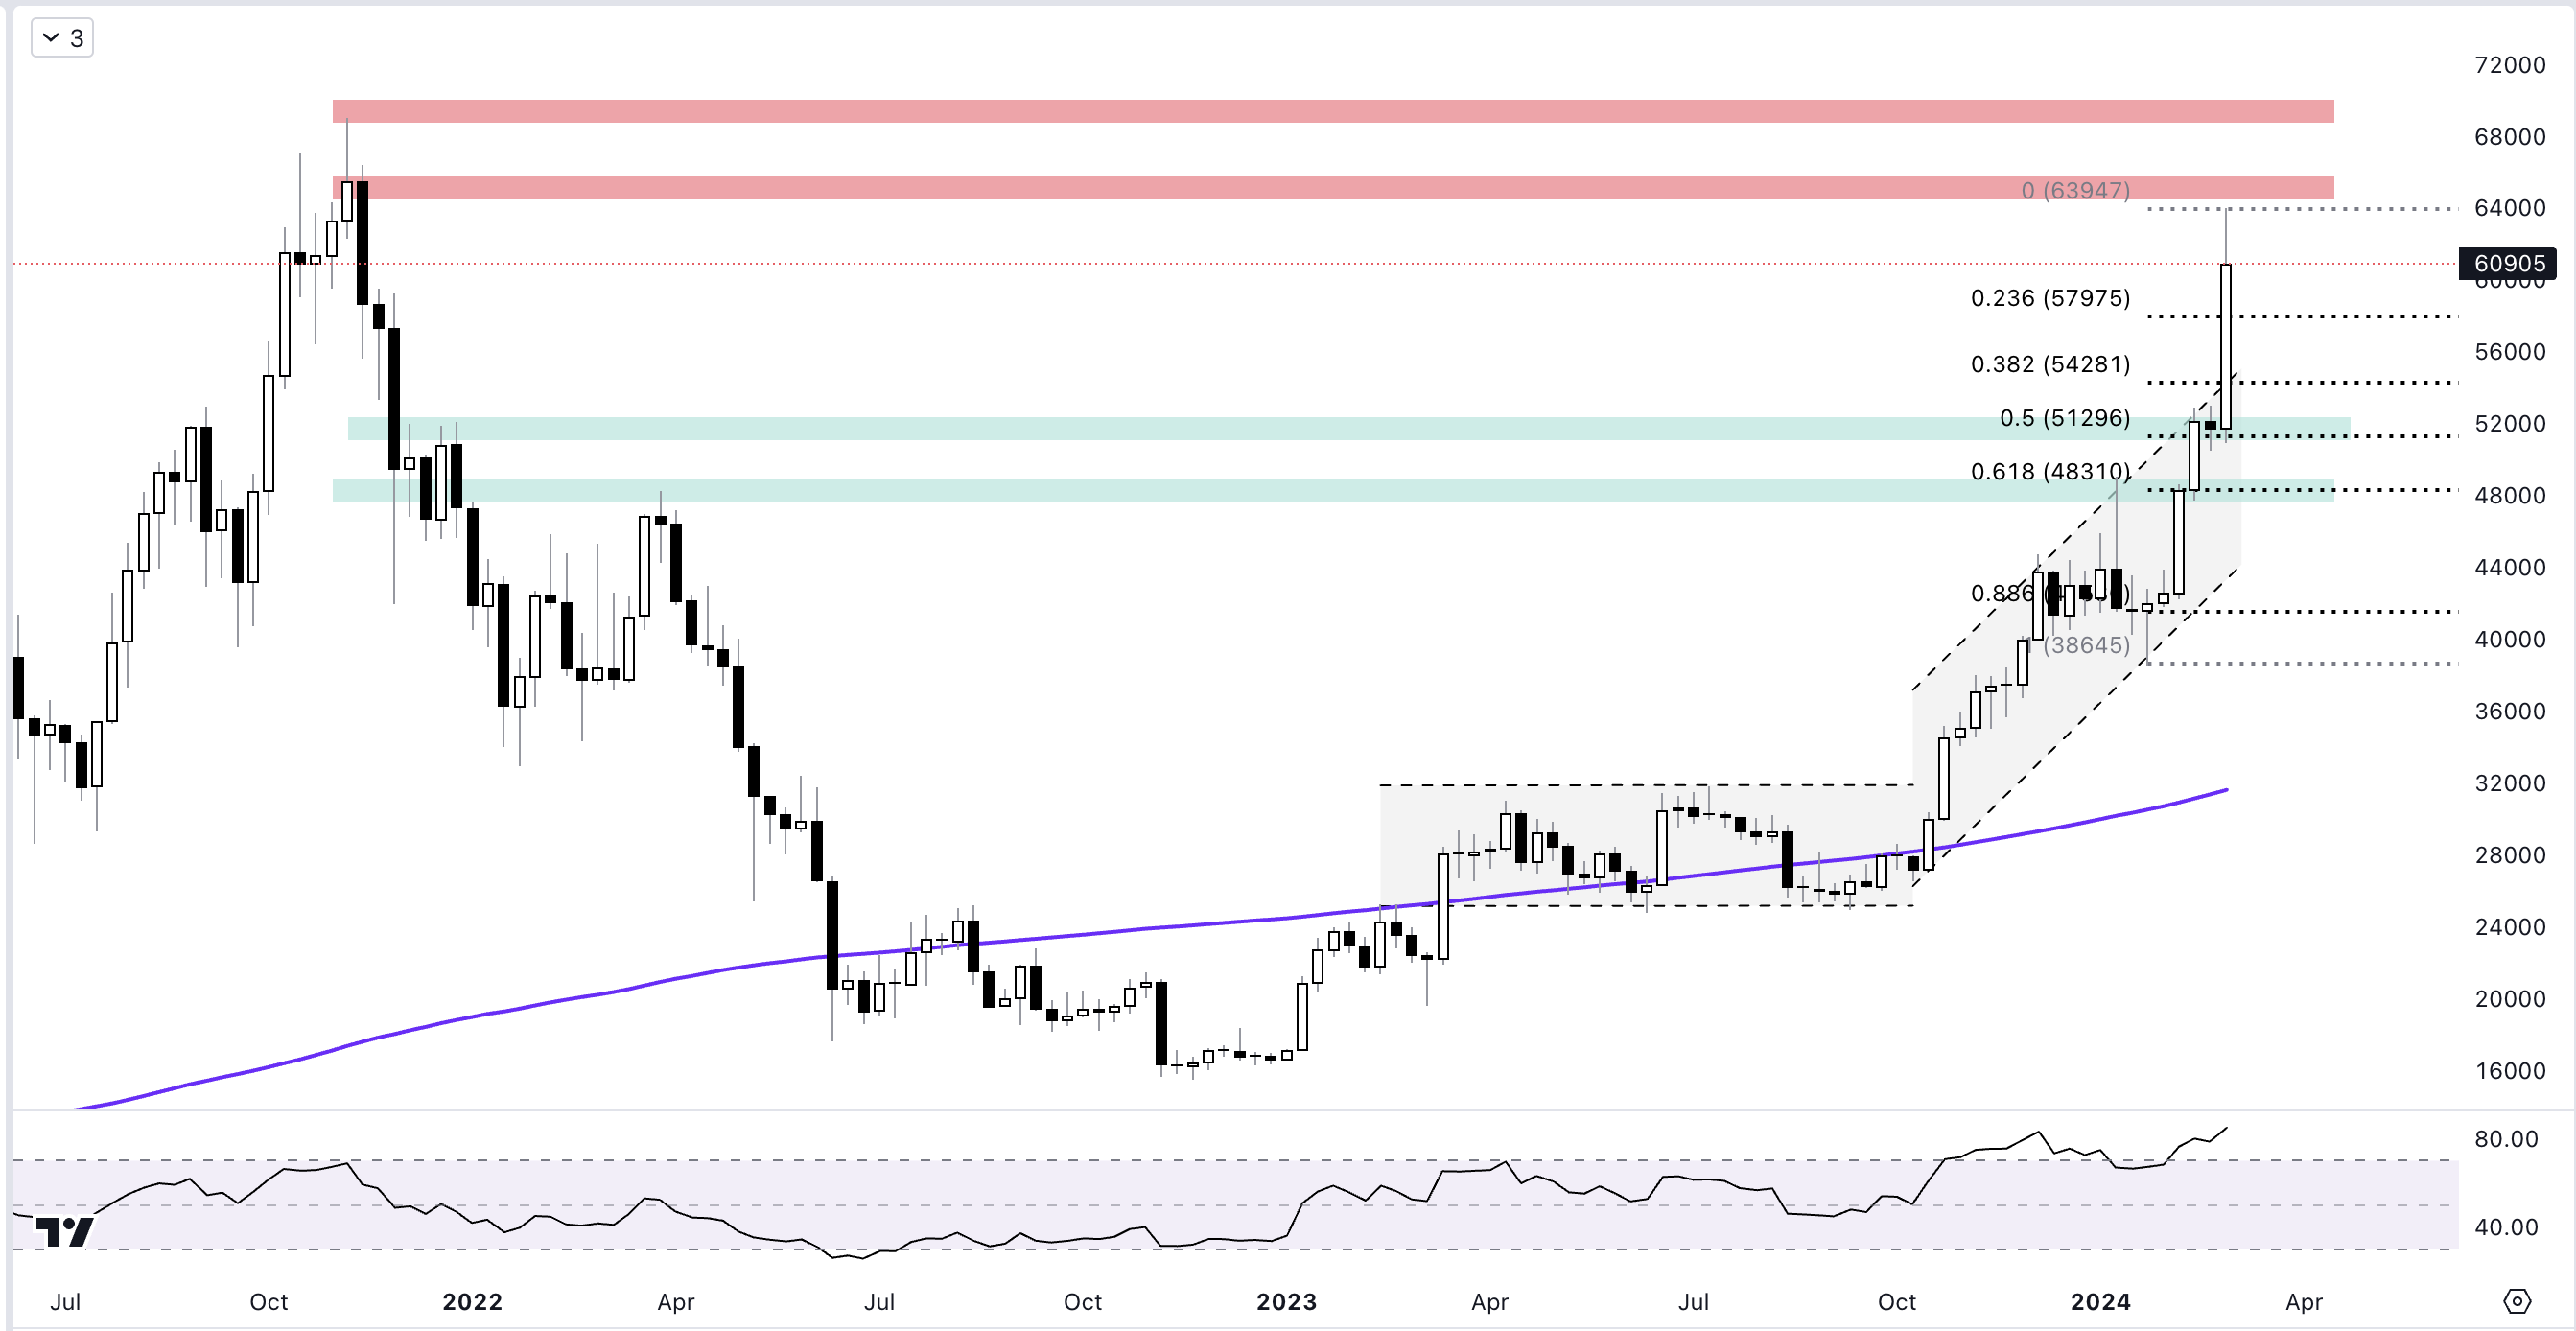
On a daily basis, in the Bitcoin price chart, it is possible to observe the strong increase that has remained practically without setbacks, from the minimum reached in November 2022 around 15,500. After breaking the bullish channel and breaking important resistance levels upwards, it would seem that Bitcoin has no ceiling and is on its way to testing the all-time high of 69,000 if it manages to break the resistance of 65,000 (an important psychological level reached in November 2021).
Although on the other hand, the RSI is at overbought levels and the strong upward impulses in prices could suggest a pause as a bearish correction in the short term. If this downward correction occurs, we could observe tests on the Fibonacci retracements plotted on the chart, which coincide with price levels that have been tested in the past.
General conclusion
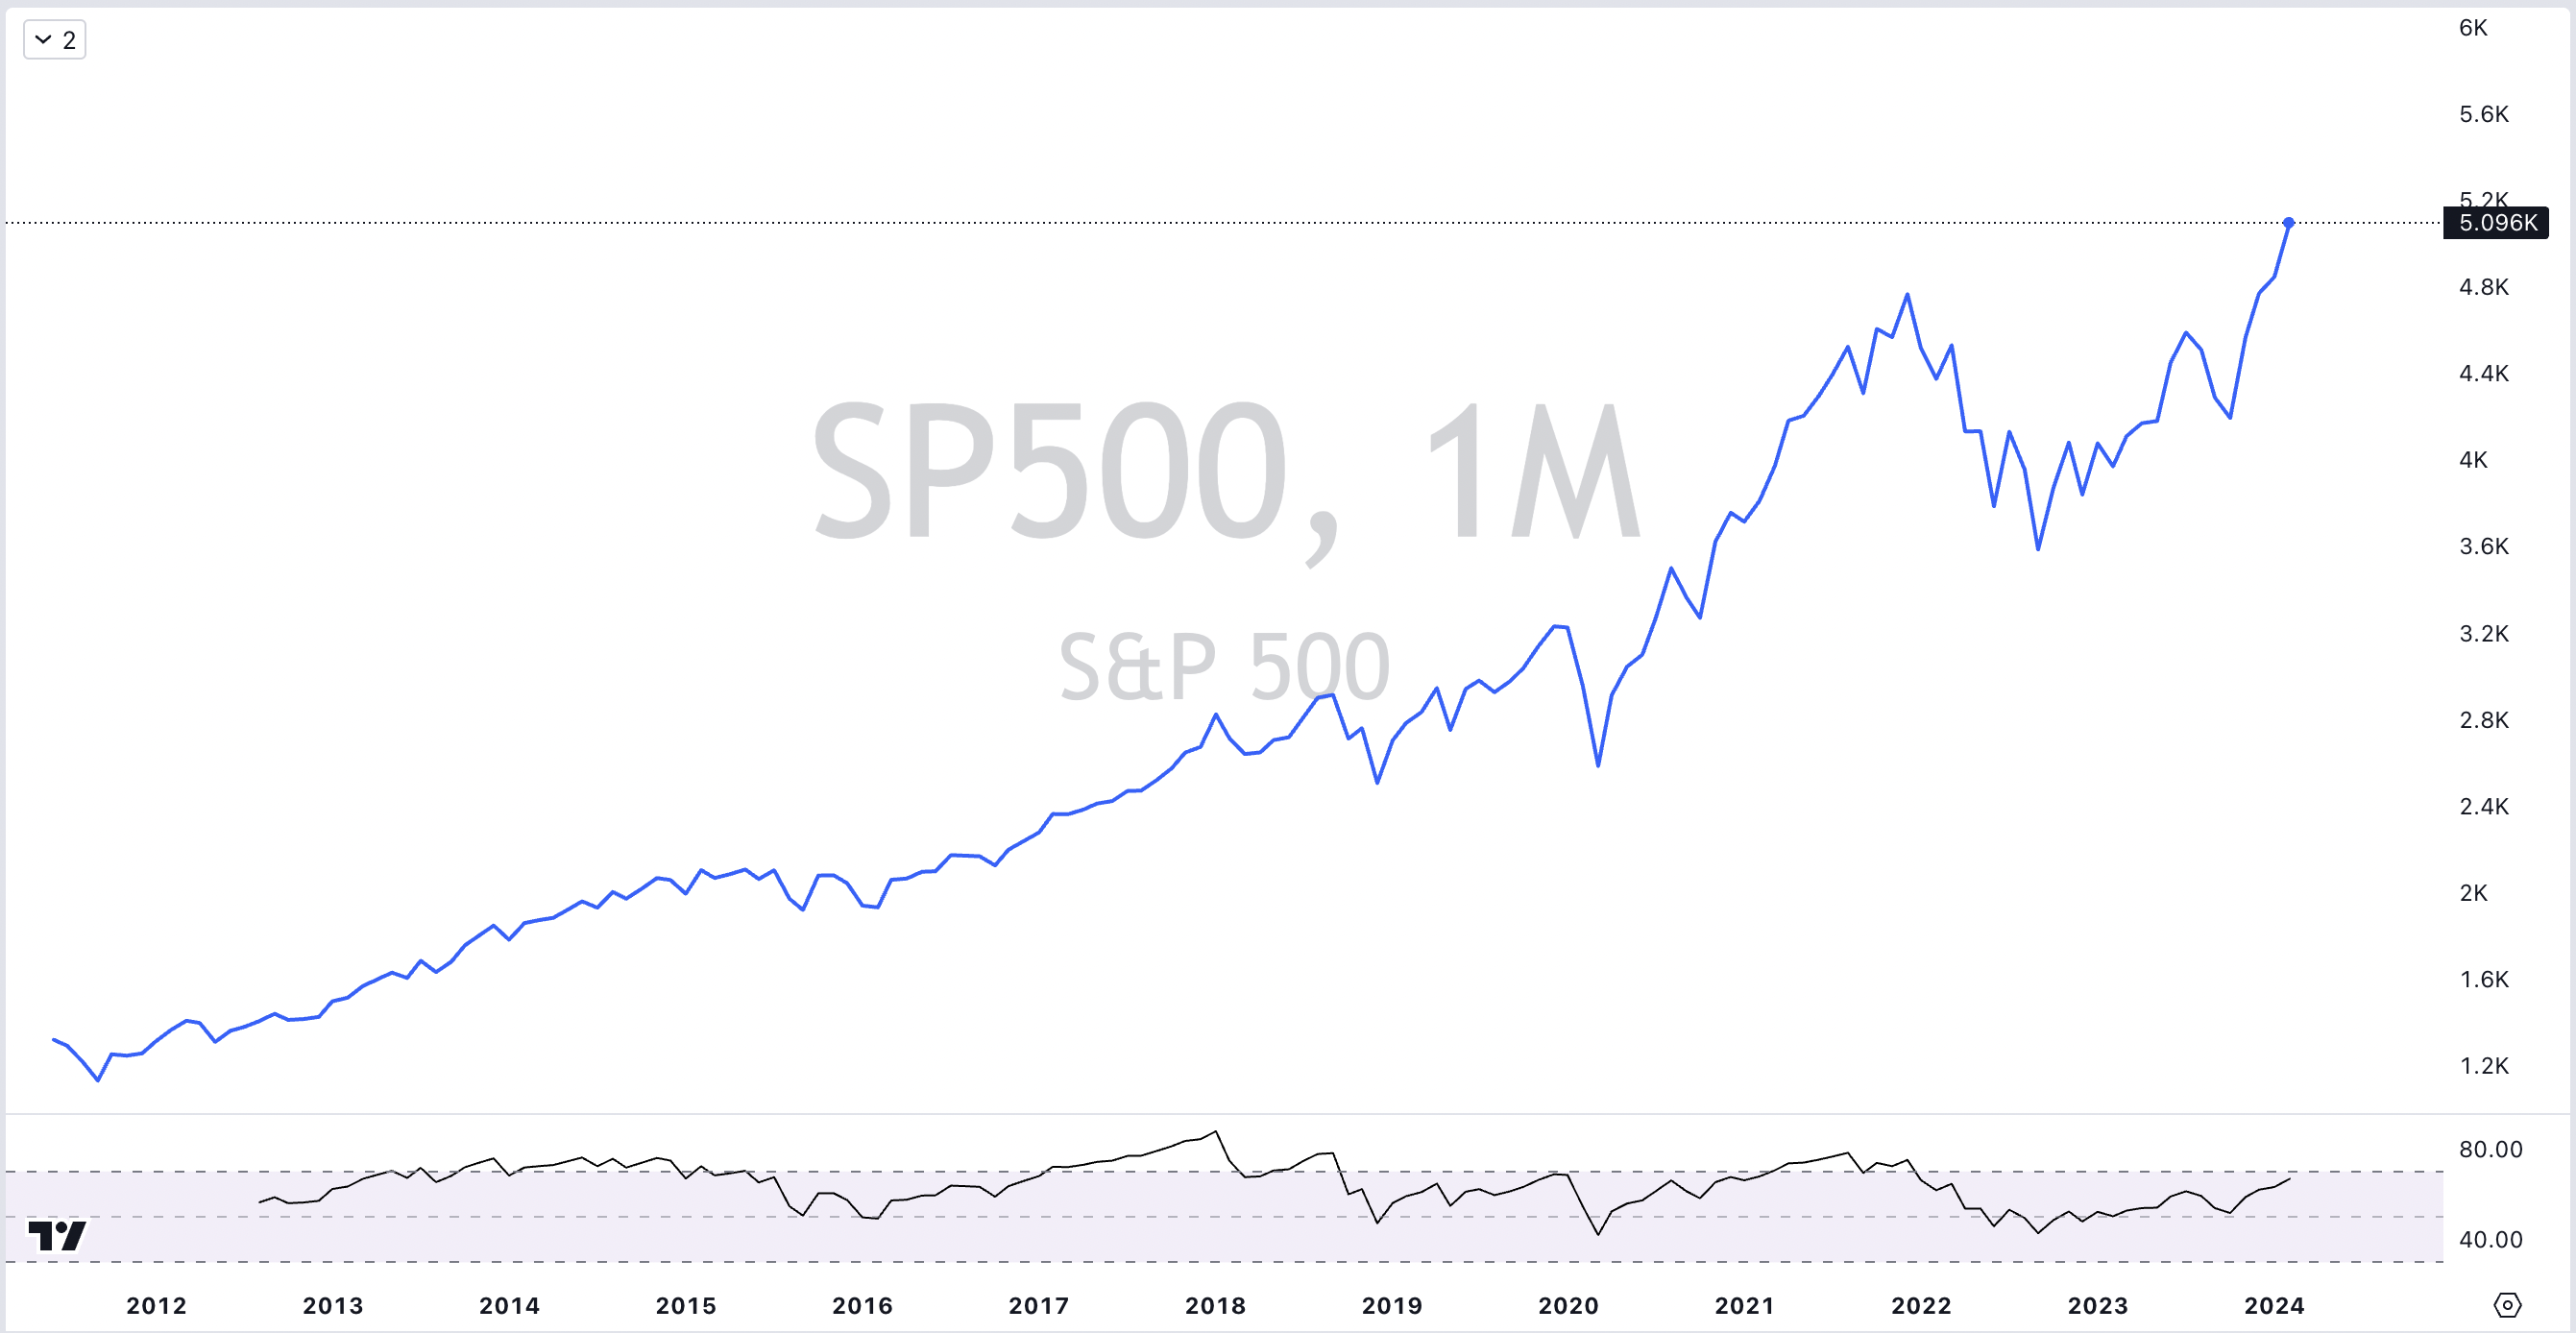
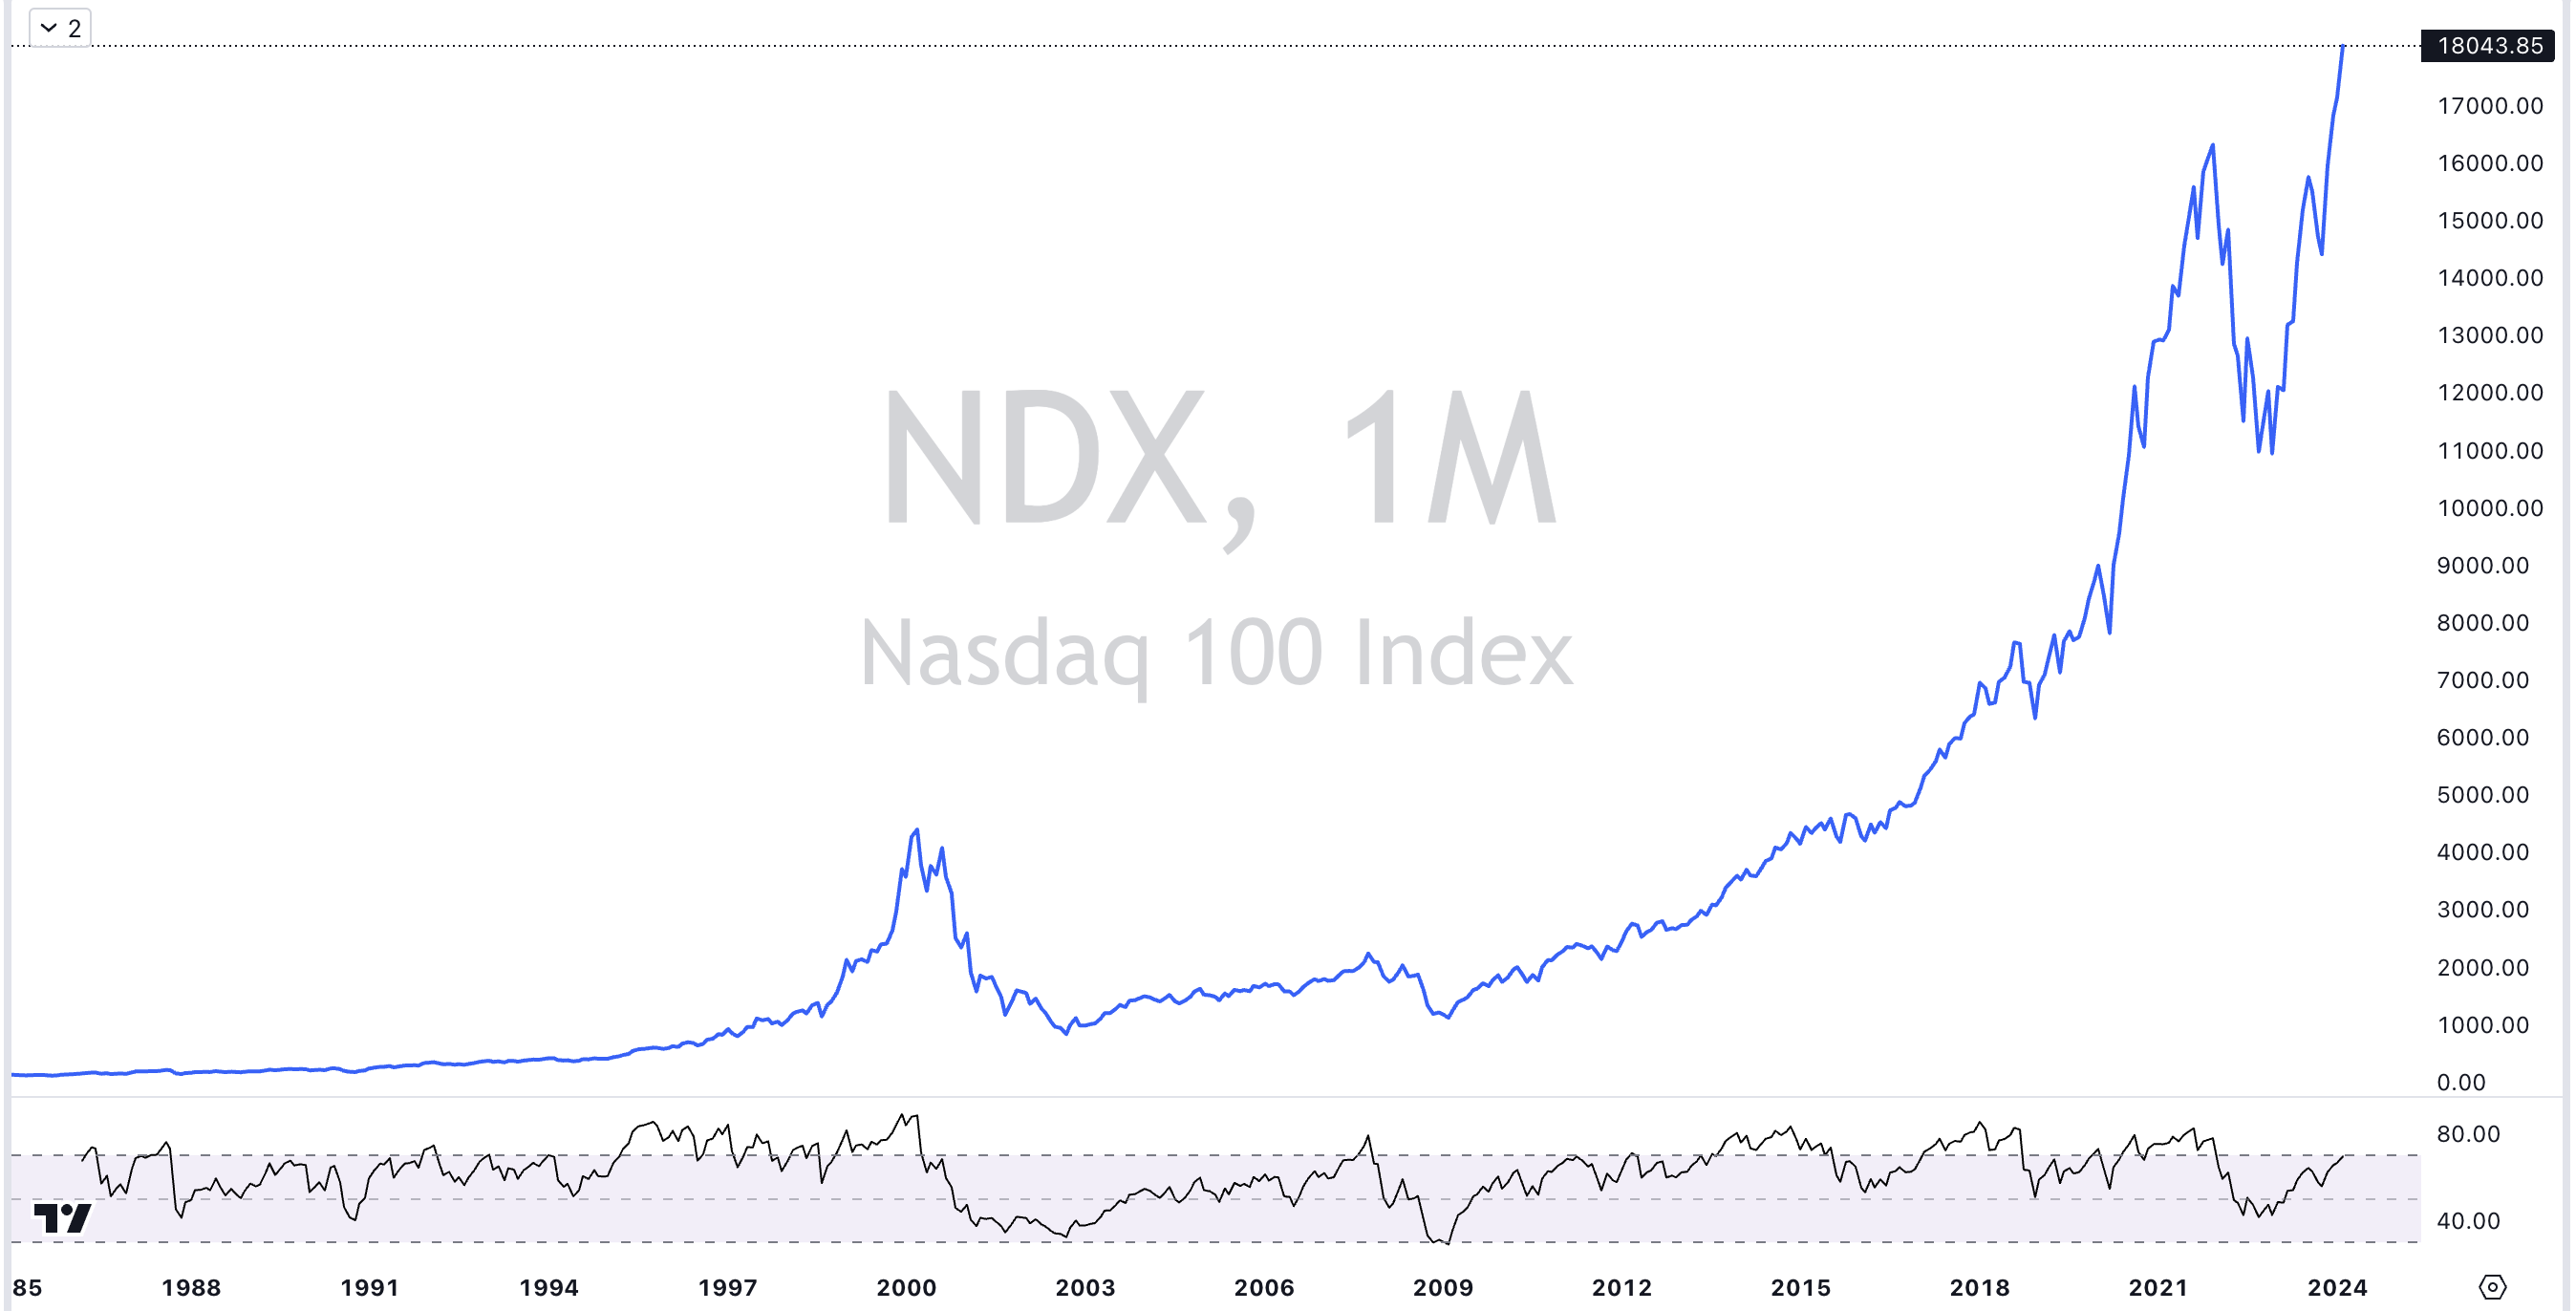
Although the general trend of Bitcoin is bullish, both from a technical and fundamental point of view, at this time it is recommended to act with caution. The state of euphoria experienced in the markets associated with an increase in risk appetite has driven not only the cryptocurrency market, but also stocks sharply upward, leading stock indices such as the S&P 500 and the Nasdaq to historical highs.
- Check out our free forex signals
- Follow the top economic events on FX Leaders economic calendar
- Trade better, discover more Forex Trading Strategies
- Open a FREE Trading Account
- Read our latest reviews on: Avatrade, Exness, HFM and XM
Related Articles


Sidebar rates
Related Posts
