S&P500, NASDAQ and DJIA Price Forecast: Is a Correction Overdue?
SP500 Price Forecast: More Upside Ahead?
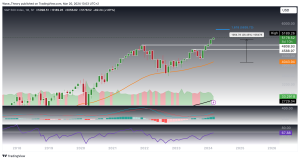
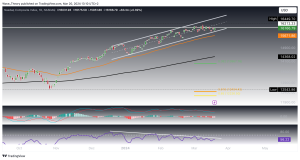
Since October of the previous year, the S&P 500 Index (SPX) has embarked on a significant upward trajectory, appreciating by over 26% and establishing a new all-time high at 5,261. Currently, the absence of visible resistance levels, with the exception of the 1.618 Fibonacci projection at 5,638, suggests a potential for continued upward movement. However, the SPX may encounter resistance at this level, as indicated by a pronounced bearish divergence on the Relative Strength Index (RSI) in the monthly chart.
Conversely, the Moving Average Convergence Divergence (MACD) indicators present a bullish outlook, with the MACD lines forming a bullish configuration and the histogram exhibiting a notable upward trend.
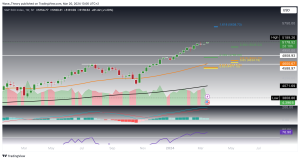
In the weekly chart, the MACD histogram begins to display signs of a bearish trend. Additionally, the RSI has entered overbought territory. Should the SPX undergo a correction, it is expected to find substantial support between 4,607 and 4,809, where it encounters two significant Fibonacci levels and the 50-week exponential moving average (EMA), providing additional support.
Should the SPX continue its ascent towards the 1.618 Fibonacci level and subsequently face rejection, a retracement to the next Fibonacci levels at 5,045 and 4,650 could occur.
In the daily chart, although the RSI already exhibits a bearish divergence, the SPX persists in its upward movement within the channel. The Exponential Moving Averages (EMAs) have undergone a golden crossover, further affirming the bullish trend. However, the MACD signals bearish tendencies as the MACD lines have crossed in a bearish manner. It appears the SPX may sustain its upward trajectory but could soon undergo a correction.
Will IXIC Face Rejection at the Resistance?
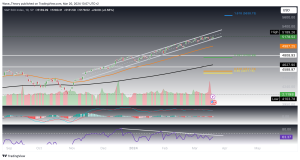
The Nasdaq Composite Index (IXIC) has experienced a surge of approximately 64% since October of the previous year, rebounding from the golden ratio support at 10,100. It now approaches significant resistance at the previous all-time high of 16,212, with the RSI indicating a substantial bearish divergence on the monthly chart. In the event of a correction, the IXIC is poised to find its next major Fibonacci supports at 13,968 and 12,385, with the 50-month EMA at 12,385 serving as additional support.
While the RSI suggests a strong bearish signal, the MACD continues to provide bullish indications, with the MACD lines in a bullish formation and the histogram trending upwards.
Similar to the SPX, the IXIC maintains its upward trajectory within an upward channel, despite the RSI showing a bearish divergence in the daily chart. The EMAs’ golden crossover corroborates the bullish trend.
However, the MACD lines have already crossed in a bearish manner. Overall, the indicators suggest the potential for a short-term correction, while the mid-term trend remains bullish.
Can DJIA Break Trough Resistance?
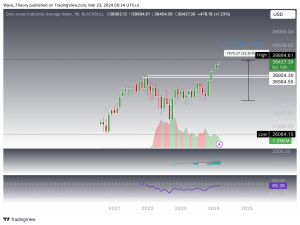
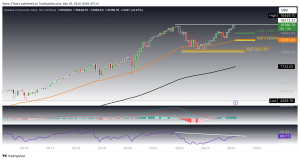
The Dow Jones Industrial Average Index (US30) has also demonstrated an upward trend since October 2022, with a recovery of approximately 23.5%. It is currently trading at an all-time-high and faces no resistances other than the 1.618 Fib projection at 42,125. Furthermore, the MACD gives bullish signs in the monthly chart while the RSI is moving in neutral regions. US30 is set to continue its surge towards the Fib projection at 42,125 in the mid-term.
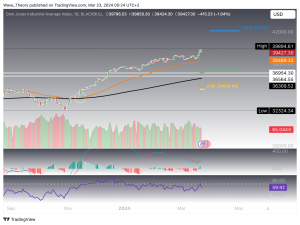
In the daily chart, the bullish trend is further confirmed by a golden crossover of the EMAs and the bullish formation of the MACD lines. However, the RSI indicates a bearish divergence, and the MACD histogram begins to give bearish signs.
- Check out our free forex signals
- Follow the top economic events on FX Leaders economic calendar
- Trade better, discover more Forex Trading Strategies
- Open a FREE Trading Account