Gold Price Near $2,513 as China Demand Rises, US Dollar Weakens: Key Levels to Watch
Gold is currently trading at $2,513 per ounce, slightly below its recent highs, as fresh data from the World Gold Council (WGC) revealed

Gold is currently trading at $2,513 per ounce, slightly below its recent highs, as fresh data from the World Gold Council (WGC) revealed a 17% increase in China’s net gold imports in July 2024.

This rise marks the first monthly increase since March, indicating a potential revival in demand from the world’s largest gold consumer. Alongside this, North American funds contributed to a modest uptick in gold inflows, adding approximately 8 metric tons ($403 million) in the last week.
The increase in Chinese demand is significant as it offers a counterbalance to the global economic uncertainty and the pressures from the U.S. market. The World Gold Council’s report suggests that the demand surge in China could be a sign of stabilizing consumer confidence and a growing interest in gold as a hedge against inflation and currency devaluation.
#Gold rises on Nvidia disappointment, revival of China demand
Join Our Whatsapp Group Now By Click On The Link.https://t.co/bNlgY42K5C#forexsignal #ForexMarket #XAUUSD #Xauusdgold #usoil #usdjpy #NASDAQ100 #BTCUSDT #WTI #DAX pic.twitter.com/OF0a6st7TO
— Martin Smith (@fxmartinsmith) August 29, 2024
US Dollar Weakness Fuels Gold’s Appeal
Another factor supporting gold prices is the recent weakness in the US Dollar. The US Dollar Index (DXY) dropped to the 100.90 range, retreating from its recent peak of 101.18. This decline is crucial because gold is typically inversely correlated with the dollar; as the dollar weakens, gold becomes more attractive to investors seeking safe-haven assets.
The dollar’s recent pullback is linked to growing anticipation around upcoming U.S. economic data releases, including Jobless Claims and Gross Domestic Product (GDP) figures. These indicators are expected to provide more clarity on the Federal Reserve’s (Fed) monetary policy trajectory, especially following Federal Reserve Chairman Jerome Powell’s recent speech highlighting risks to the labor market from maintaining high-interest rates.
Investors are particularly interested in the potential implications of these data releases on interest rates. A weak jobs report could heighten expectations for a quicker easing of monetary policy, making gold more appealing due to its non-interest-bearing nature.
Technical Analysis: Key Levels and Economic Indicators to Watch
As gold navigates the current market conditions, traders should keep a close eye on key price levels and upcoming economic data releases, which could influence gold’s trajectory in the coming days.
- Key Price Levels:
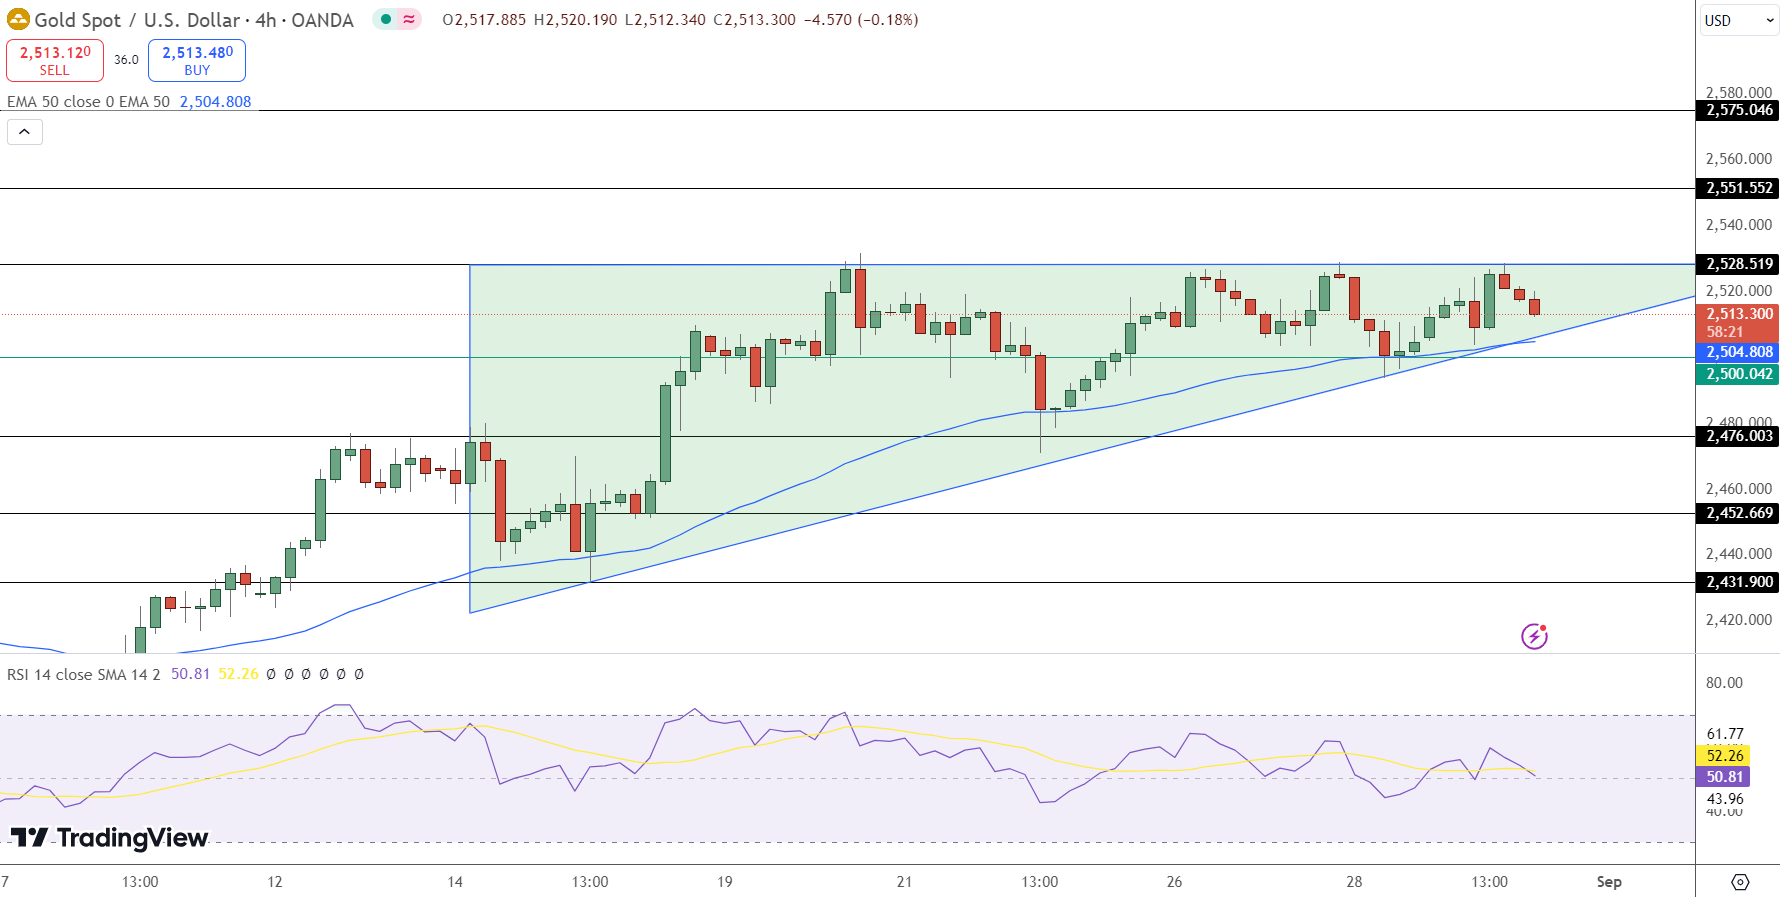
- Resistance: $2,528, the upper boundary of the ascending triangle on the 4-hour chart. A break above this level could signal a continuation of the uptrend, potentially pushing prices toward the next resistance at $2,551.
- Support: $2,505, closely aligned with the lower trendline of the ascending triangle and reinforced by the 50-period EMA at $2,504. A breach below this level might trigger a corrective phase, leading to a decline toward $2,476.
The ascending triangle pattern observed on the 4-hour chart typically indicates a bullish trend, where buyers gradually gain control, pushing prices higher with each upward thrust. The resistance at $2,528 is crucial, as a breakout above this level could lead to a strong uptrend continuation. However, if gold fails to break through this resistance, it could consolidate or retrace towards the support levels mentioned.
China’s net #gold imports via Hong Kong rose by ~17% in July compared to June, reports @KitcoNewsNOW. The increased imports, however, are unlikely to be driven by demand from the country’s jewelry sector, which has been hammered by high prices for the precious metal in 2024. pic.twitter.com/JxAmuYZhAe
— U.S. Global Investors (@USFunds) August 28, 2024
- Technical Indicators:
- RSI: The Relative Strength Index (RSI) is hovering around the neutral 50 mark, suggesting a balanced sentiment in the market. A decisive move above or below this level could signal the next directional move in gold prices.
- Moving Averages: The 50-period Exponential Moving Average (EMA) at $2,504 serves as a critical support level. A sustained move above this EMA could reinforce bullish sentiment, while a breakdown below might indicate the start of a downward trend.
- Upcoming Economic Events:
- Core PCE Price Index (YoY): Expected to rise to 2.7% in July, from 2.6% in June. A higher-than-expected reading could weaken gold by suggesting the Fed needs to keep interest rates elevated.
- Personal Income and Spending Data: Both are projected to increase, with spending expected to rise by 0.5%, which could provide insights into consumer confidence and economic momentum.
- Revised GDP Data: Economists predict the Q2 GDP to hold steady at 2.8%. Any deviation could impact the Fed’s policy outlook and, by extension, gold prices.

Friday’s release of the Personal Consumption Expenditures (PCE) Price Index, the Fed’s preferred inflation gauge, will be pivotal. Any significant divergence from expectations could shift market sentiment and influence gold’s movement. A higher inflation figure could suggest prolonged higher interest rates, weighing on gold, while a lower figure might boost gold as it would hint at an earlier rate cut.
Gold’s near-term outlook remains closely tied to these key economic indicators and the broader movements in the U.S. dollar.
- Check out our free forex signals
- Follow the top economic events on FX Leaders economic calendar
- Trade better, discover more Forex Trading Strategies
- Open a FREE Trading Account


