Intel Stock Faces Critical Support After 63% Decline – Is More Downside Ahead?

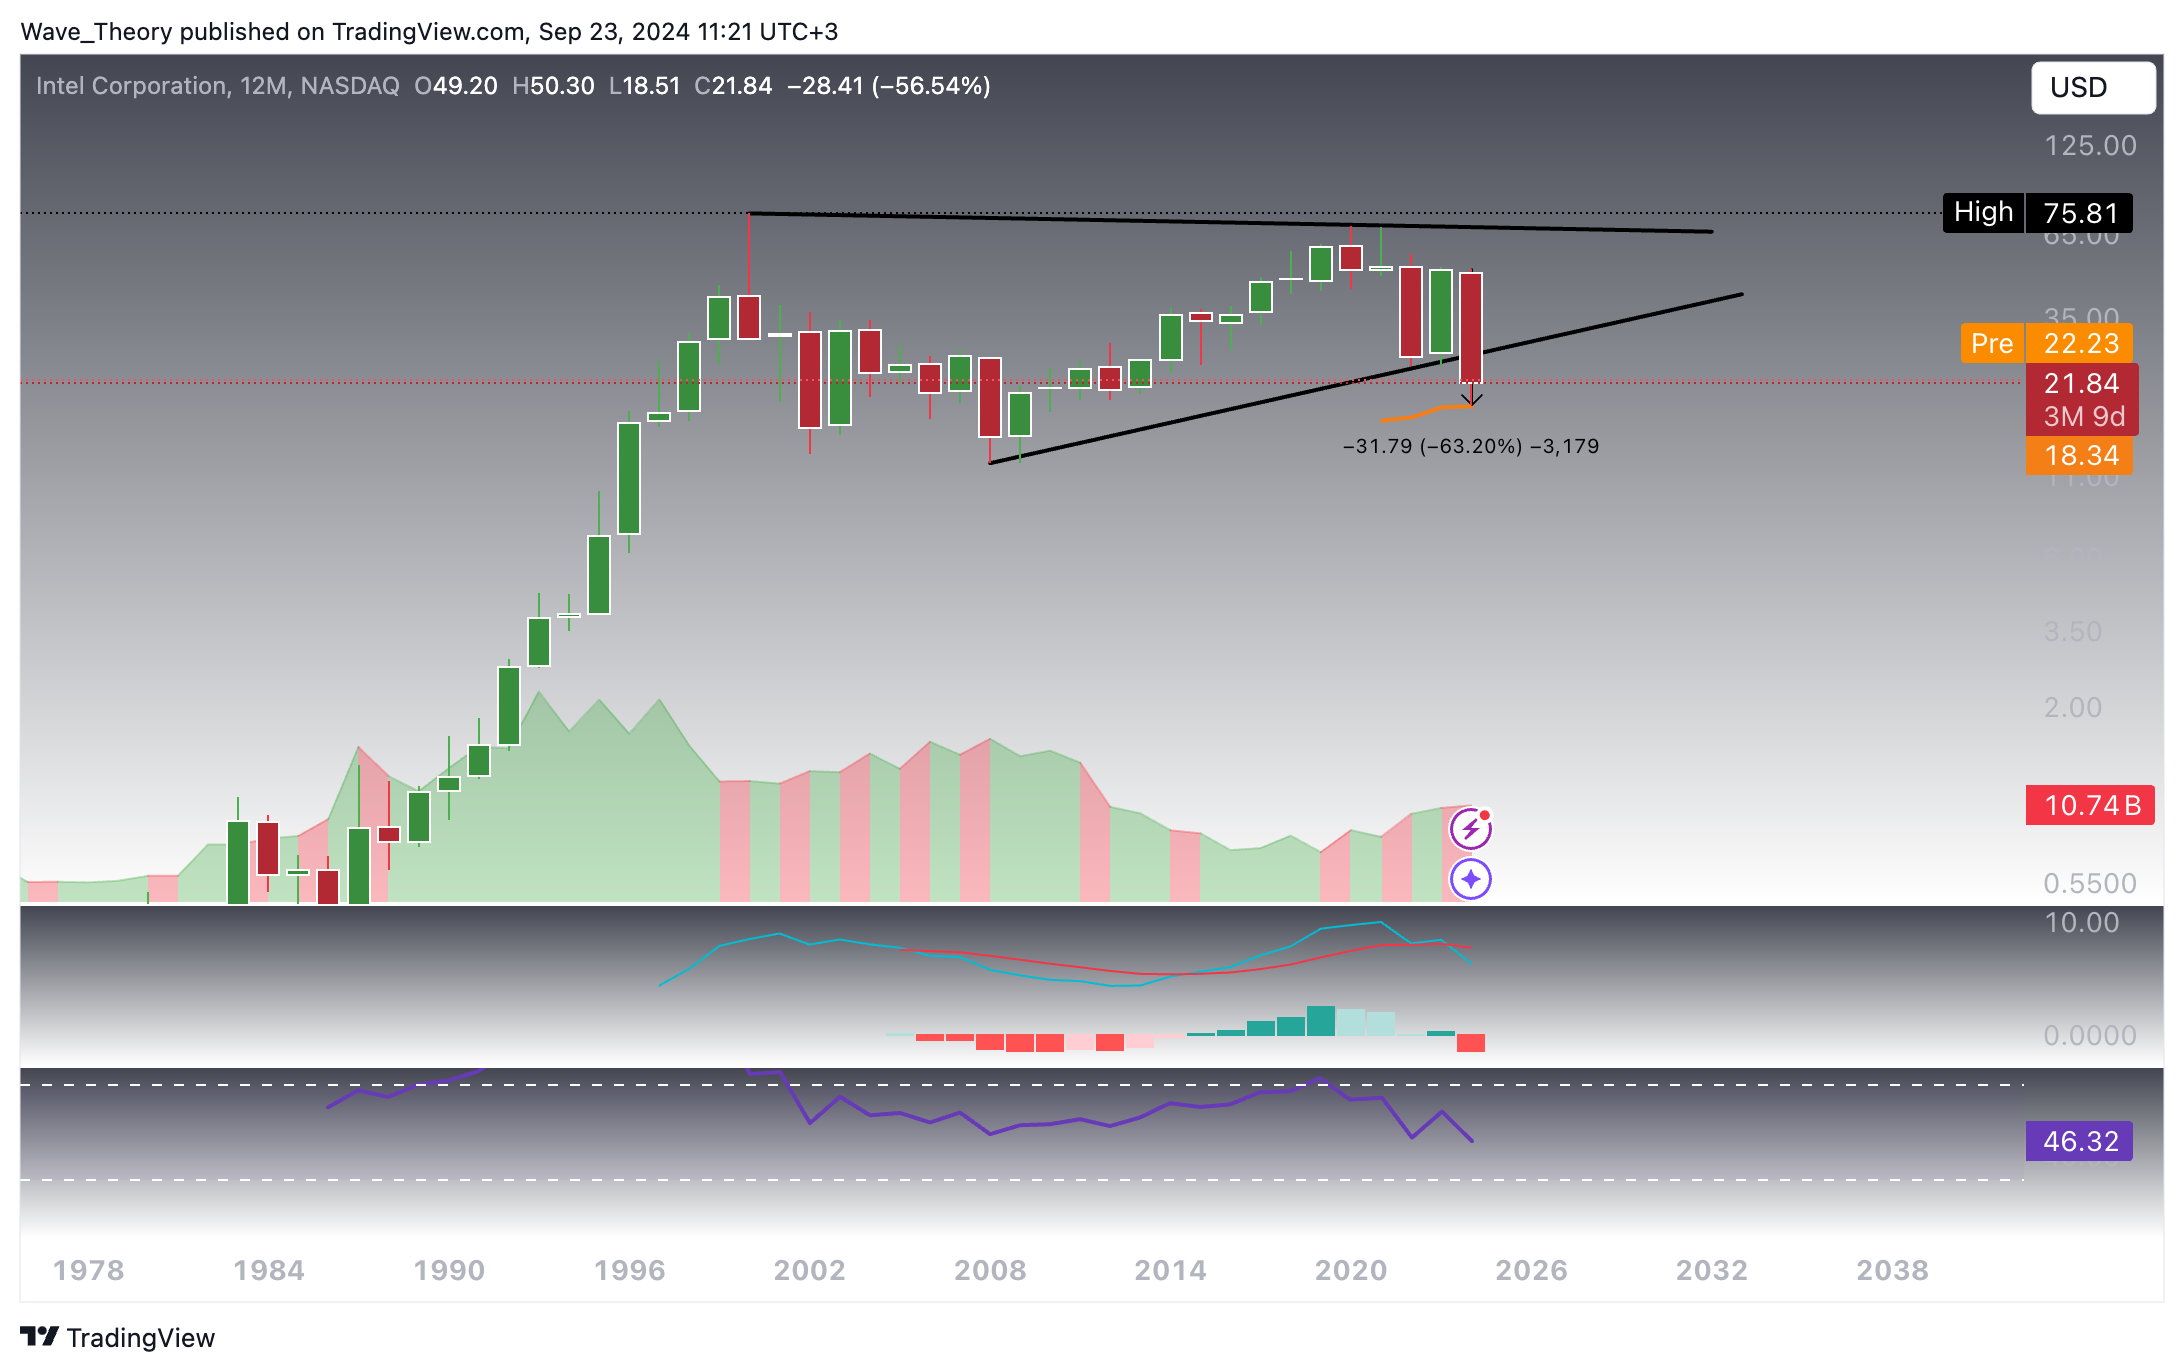
The Intel stock has experienced a very bearish year, falling by over 63 % so far. With Intel’s all-time high of $76 set more than two decades ago, the stock has struggled to regain upward momentum.
Intel Now Finds Support At The 50-Year EMA
Intel Continues Downtrend: Death Cross On The Horizon
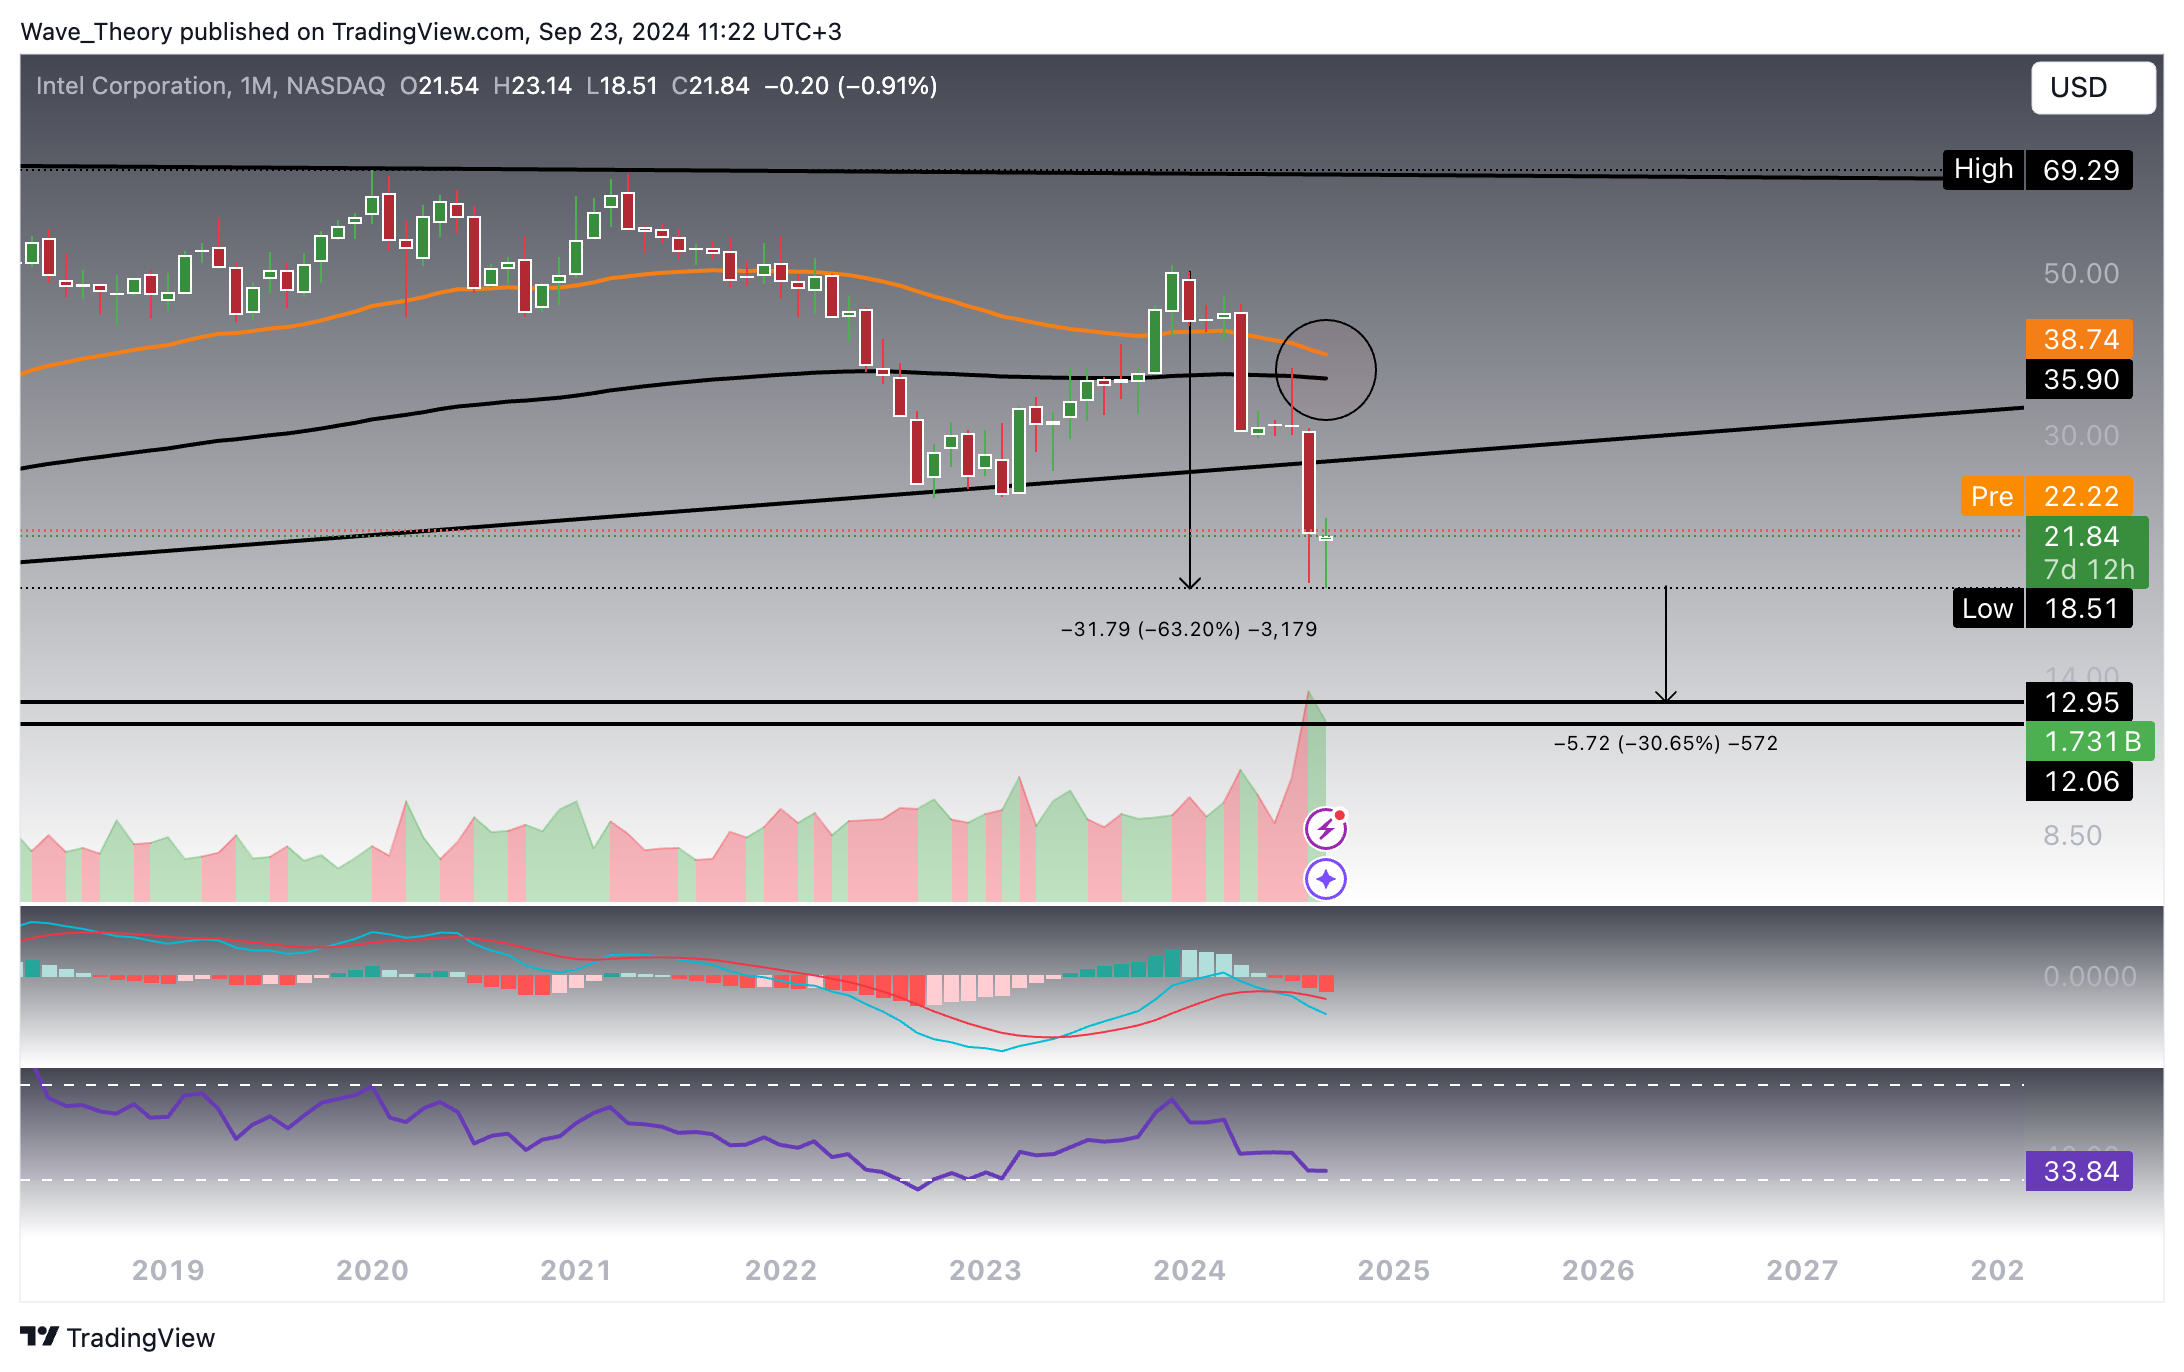
The Intel stock has been in a consistent decline for the past nine months. As a result, the EMAs are on the verge of forming a death cross on the monthly chart, which would confirm the bearish trend. Additionally, several technical indicators are signaling further bearish momentum.
Technical Indicators and Trends (Monthly Chart):
- MACD (Moving Average Convergence Divergence): The MACD lines remain bearishly crossed, with the histogram indicating a persistent bearish trend.
- RSI (Relative Strength Index): The RSI is oscillating in neutral territory but is approaching oversold regions, suggesting weakening buying pressure.
- EMA (Exponential Moving Average): Although the EMAs are currently crossed bullishly, they are likely to soon form a death cross, which would confirm the long-term bearish trend.
Should Intel continue its downtrend, it may find significant support in the range of $12 to $13. This scenario implies an additional downside of approximately 31 %, reinforcing the need for cautious trading strategies in the current market environment.
Bullish Divergence in the Weekly RSI: Intel Shows Signs of Potential Reversal
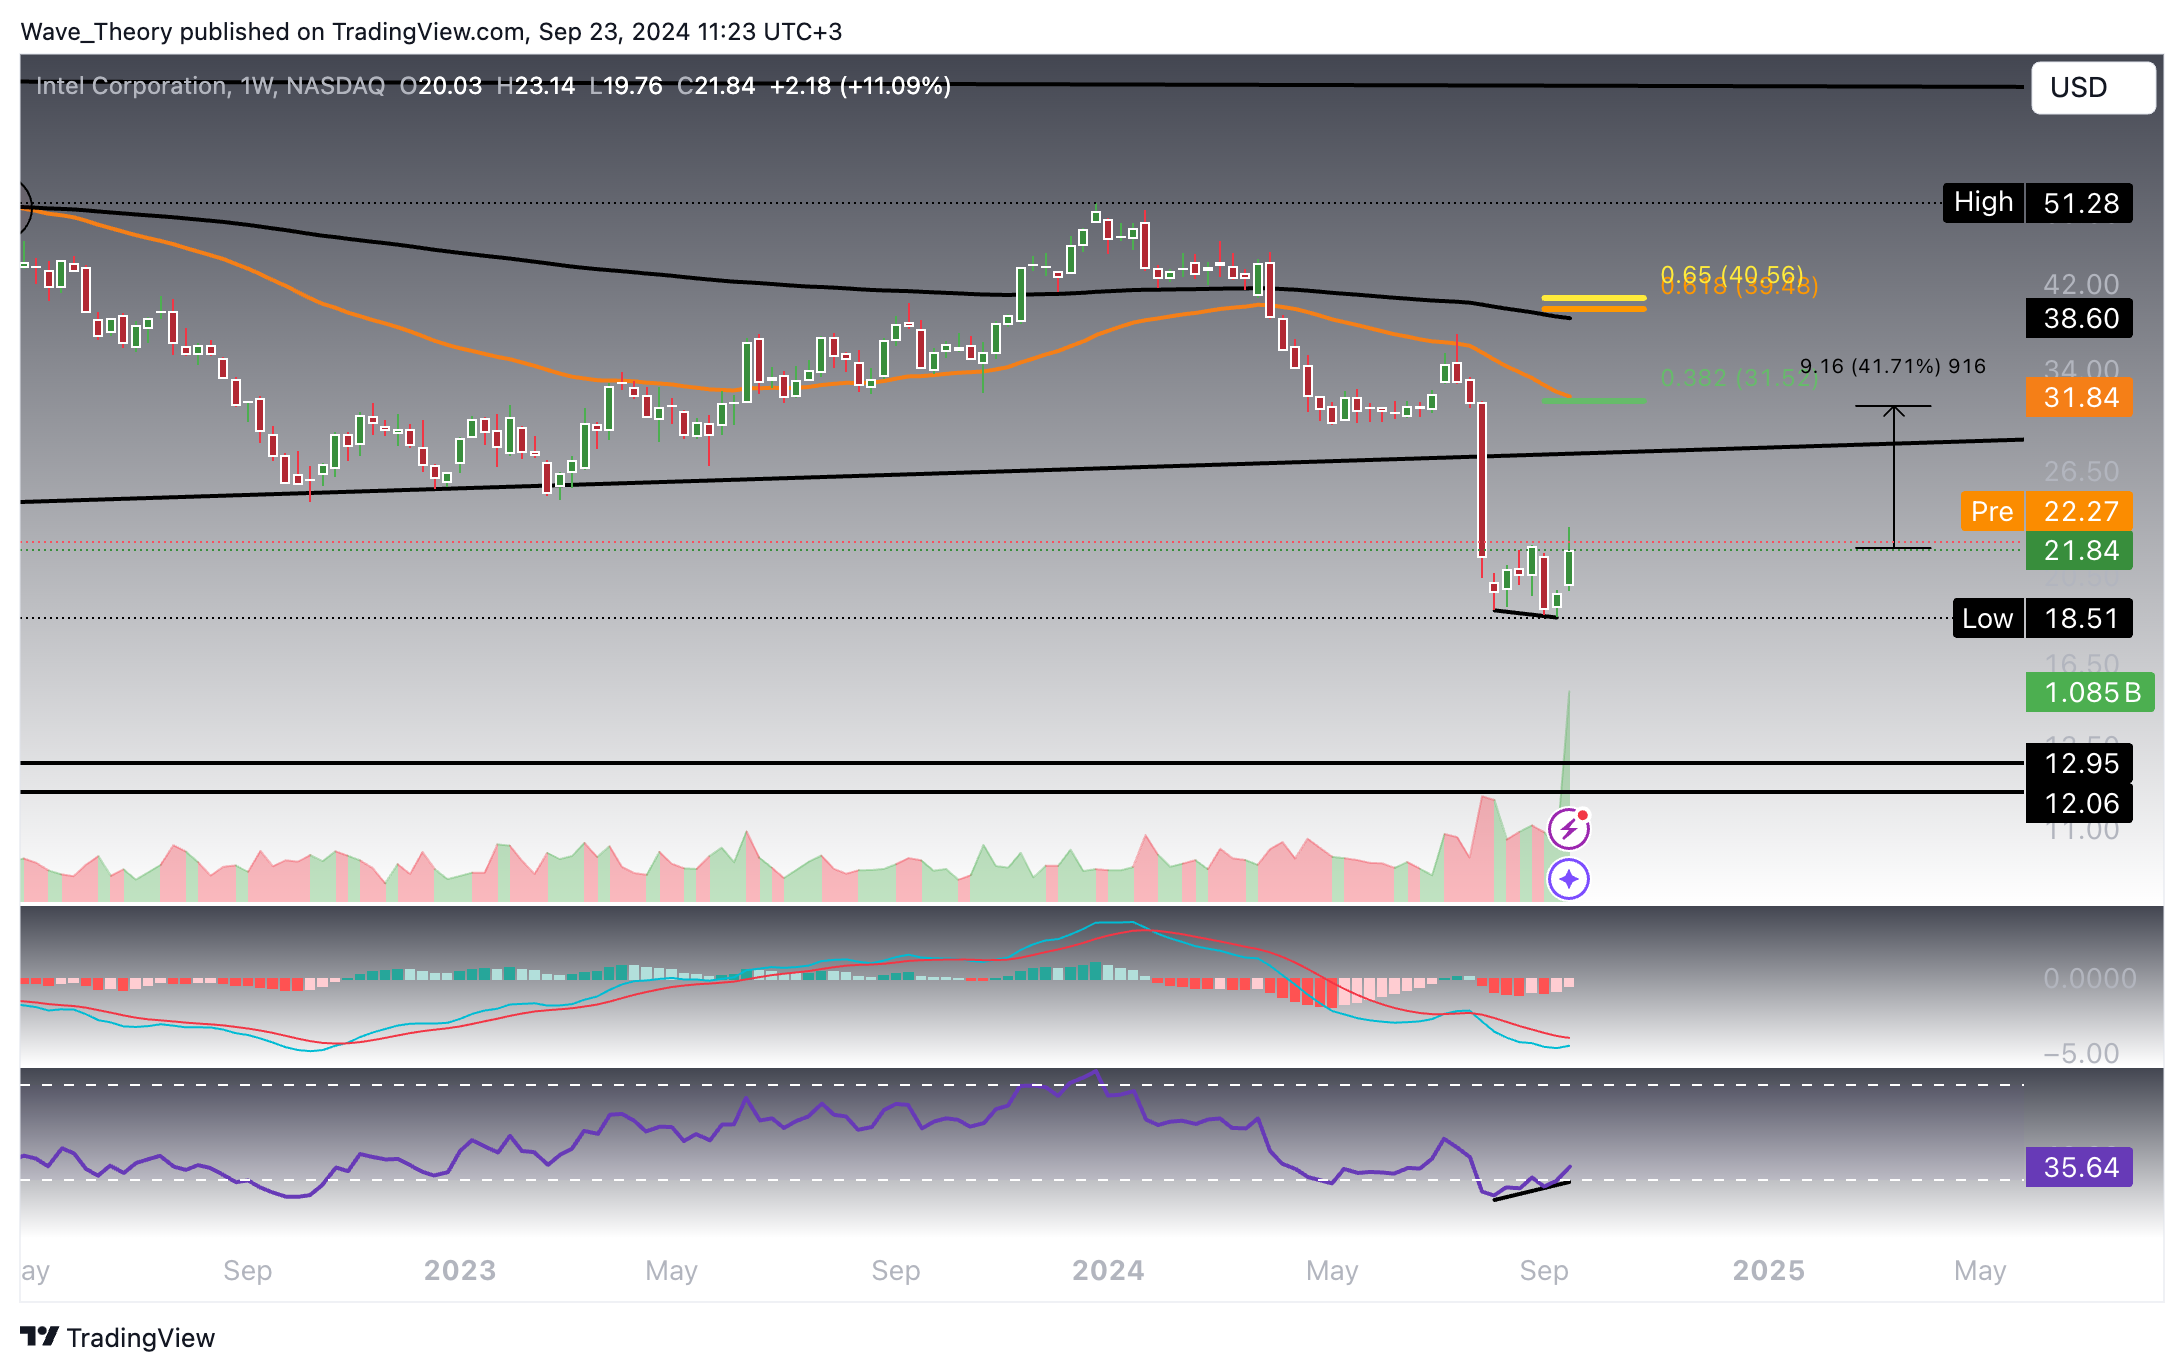
Despite the formation of a death cross in the EMAs, confirming a bearish trend in the mid-term, the weekly chart for Intel reveals some promising bullish signals.
Technical Indicators and Trends (Weekly Chart):
- RSI (Relative Strength Index): The RSI is currently forming a bullish divergence, suggesting that momentum may be shifting positively despite recent price declines.
- MACD (Moving Average Convergence Divergence): The histogram of the MACD has been ticking bullishly higher since last week, with the MACD lines potentially on the verge of crossing bullishly soon. This could indicate a forthcoming upward move.
Given these bullish indications, Intel may initiate an upward move in the coming weeks. Should the stock continue its surge, it will encounter significant Fibonacci resistance levels at $31.5 and $40.5. Here, the 50-week EMA and 200-week EMA will also serve as additional resistance points, suggesting a potential upside of approximately 42%. Traders should closely monitor these levels as Intel navigates this critical juncture.
Intel Surged By Over 25% In The Last Few Days: Key Resistance Levels Ahead
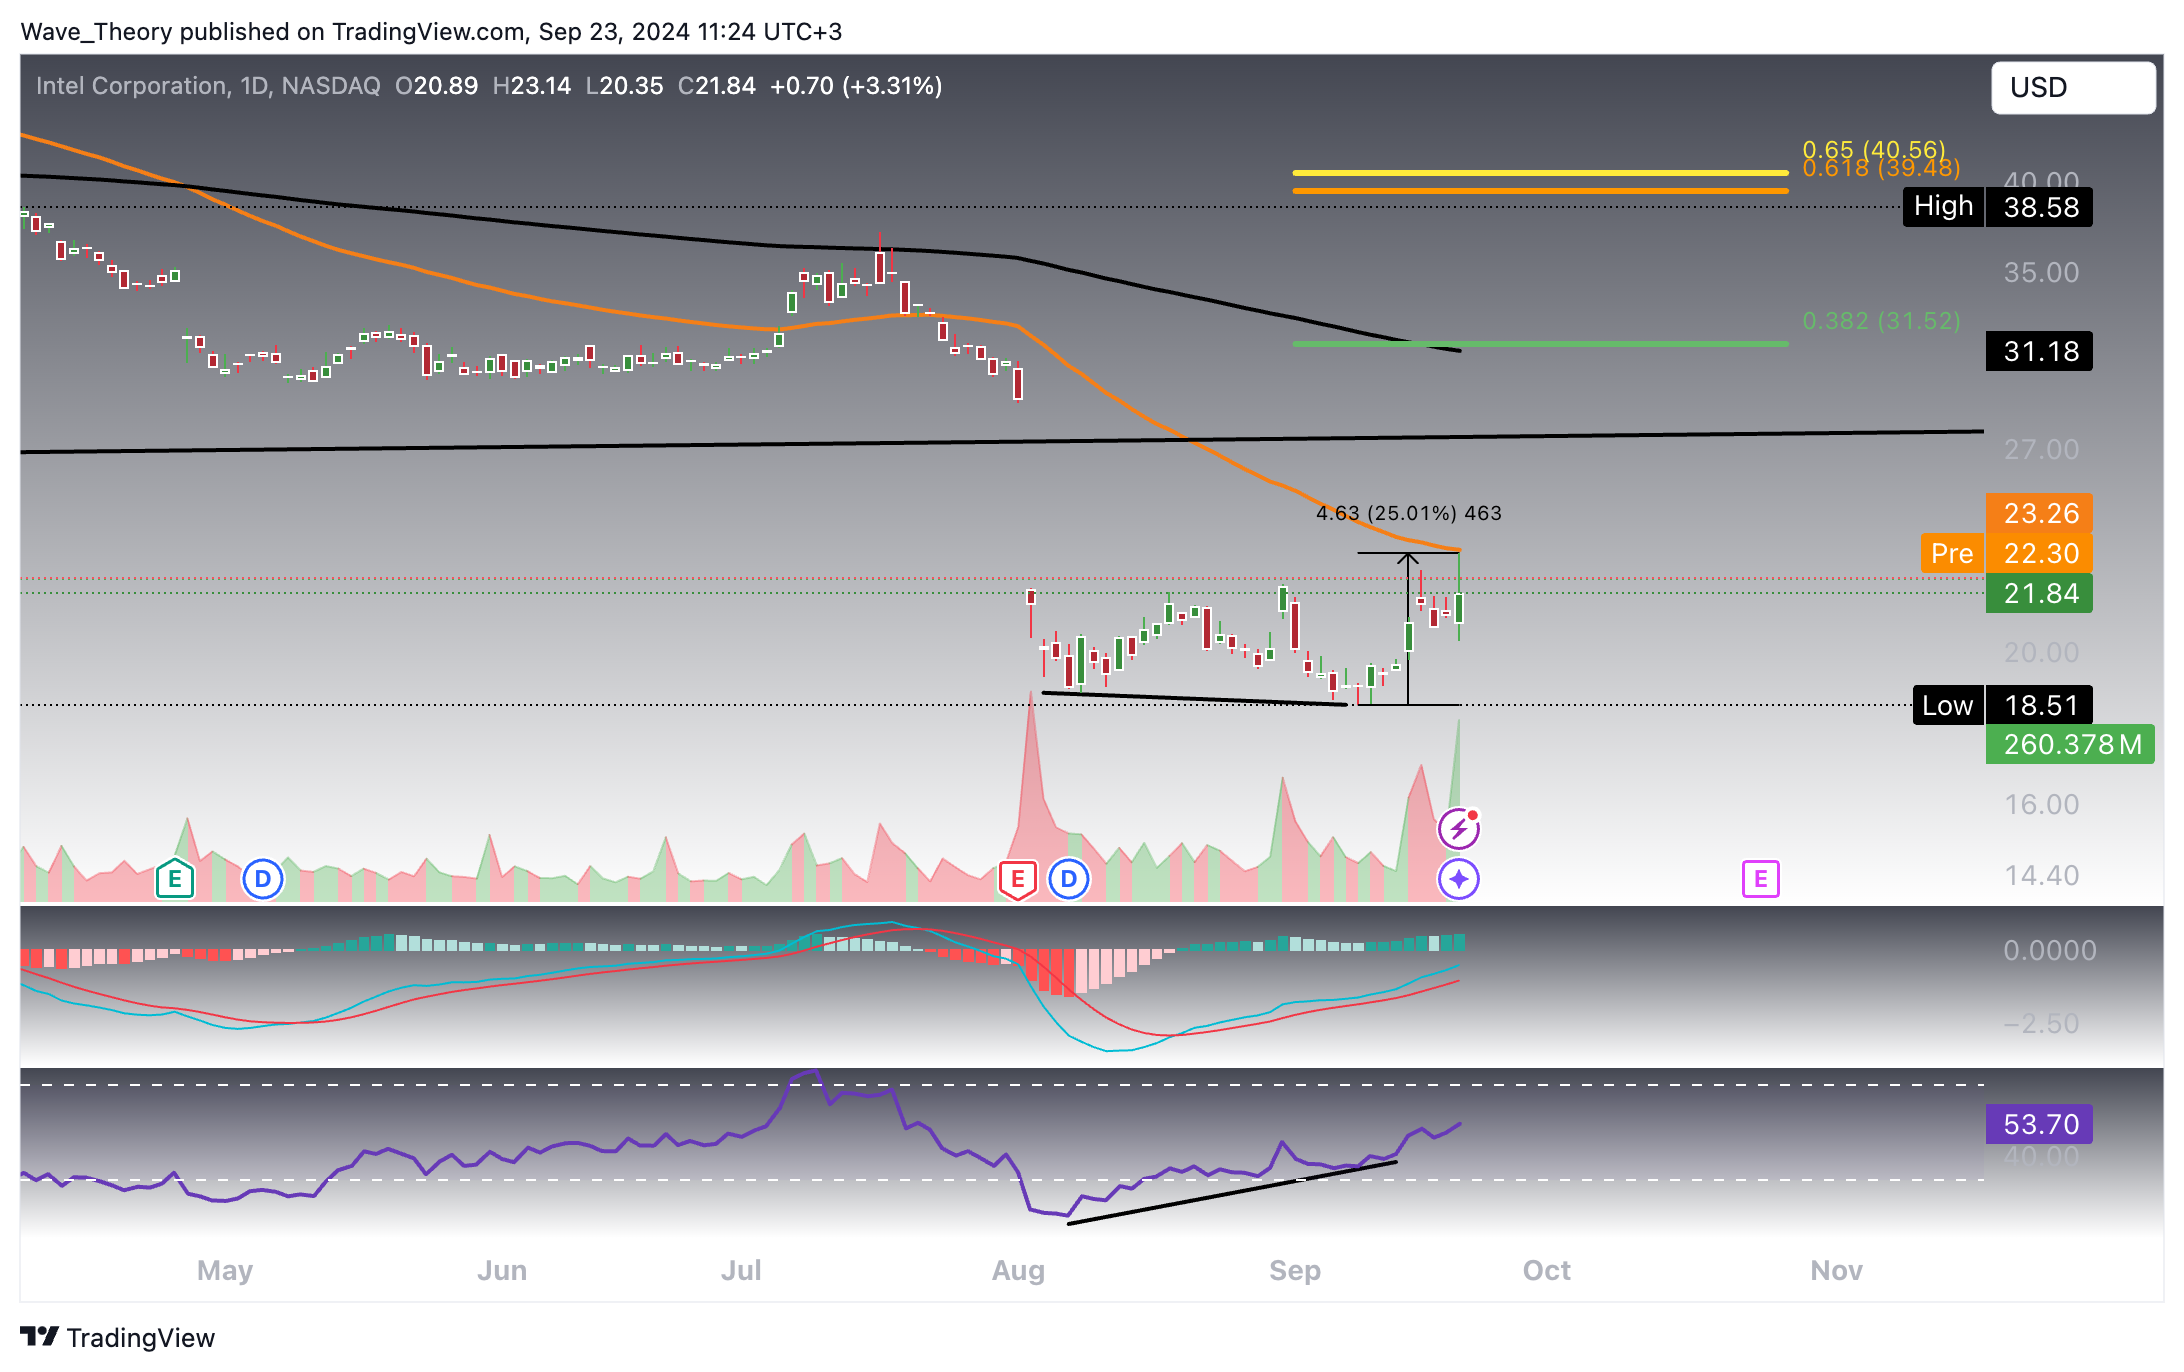
Intel has experienced a remarkable surge of over 25% in the last few days. However, the stock now faces significant resistance at the 50-day EMA at $23.26. Despite this resistance, various indicators are suggesting a bullish outlook.
Technical Indicators and Trends (Daily Chart):
- MACD (Moving Average Convergence Divergence): The MACD lines remain bullishly crossed, and the histogram continues to tick bullishly higher since yesterday, reinforcing a positive momentum.
- RSI (Relative Strength Index): The RSI is currently in neutral territory but previously formed a bullish divergence, indicating underlying strength.
- EMA (Exponential Moving Average): The EMAs have established a death cross, which confirms a bearish trend in the short- to medium-term, suggesting caution despite the recent price surge.
As Intel approaches the 50-day EMA, traders should monitor how the stock reacts to this resistance level. Continued bullish momentum could signal further gains, but the established death cross warrants a cautious approach in the near term.
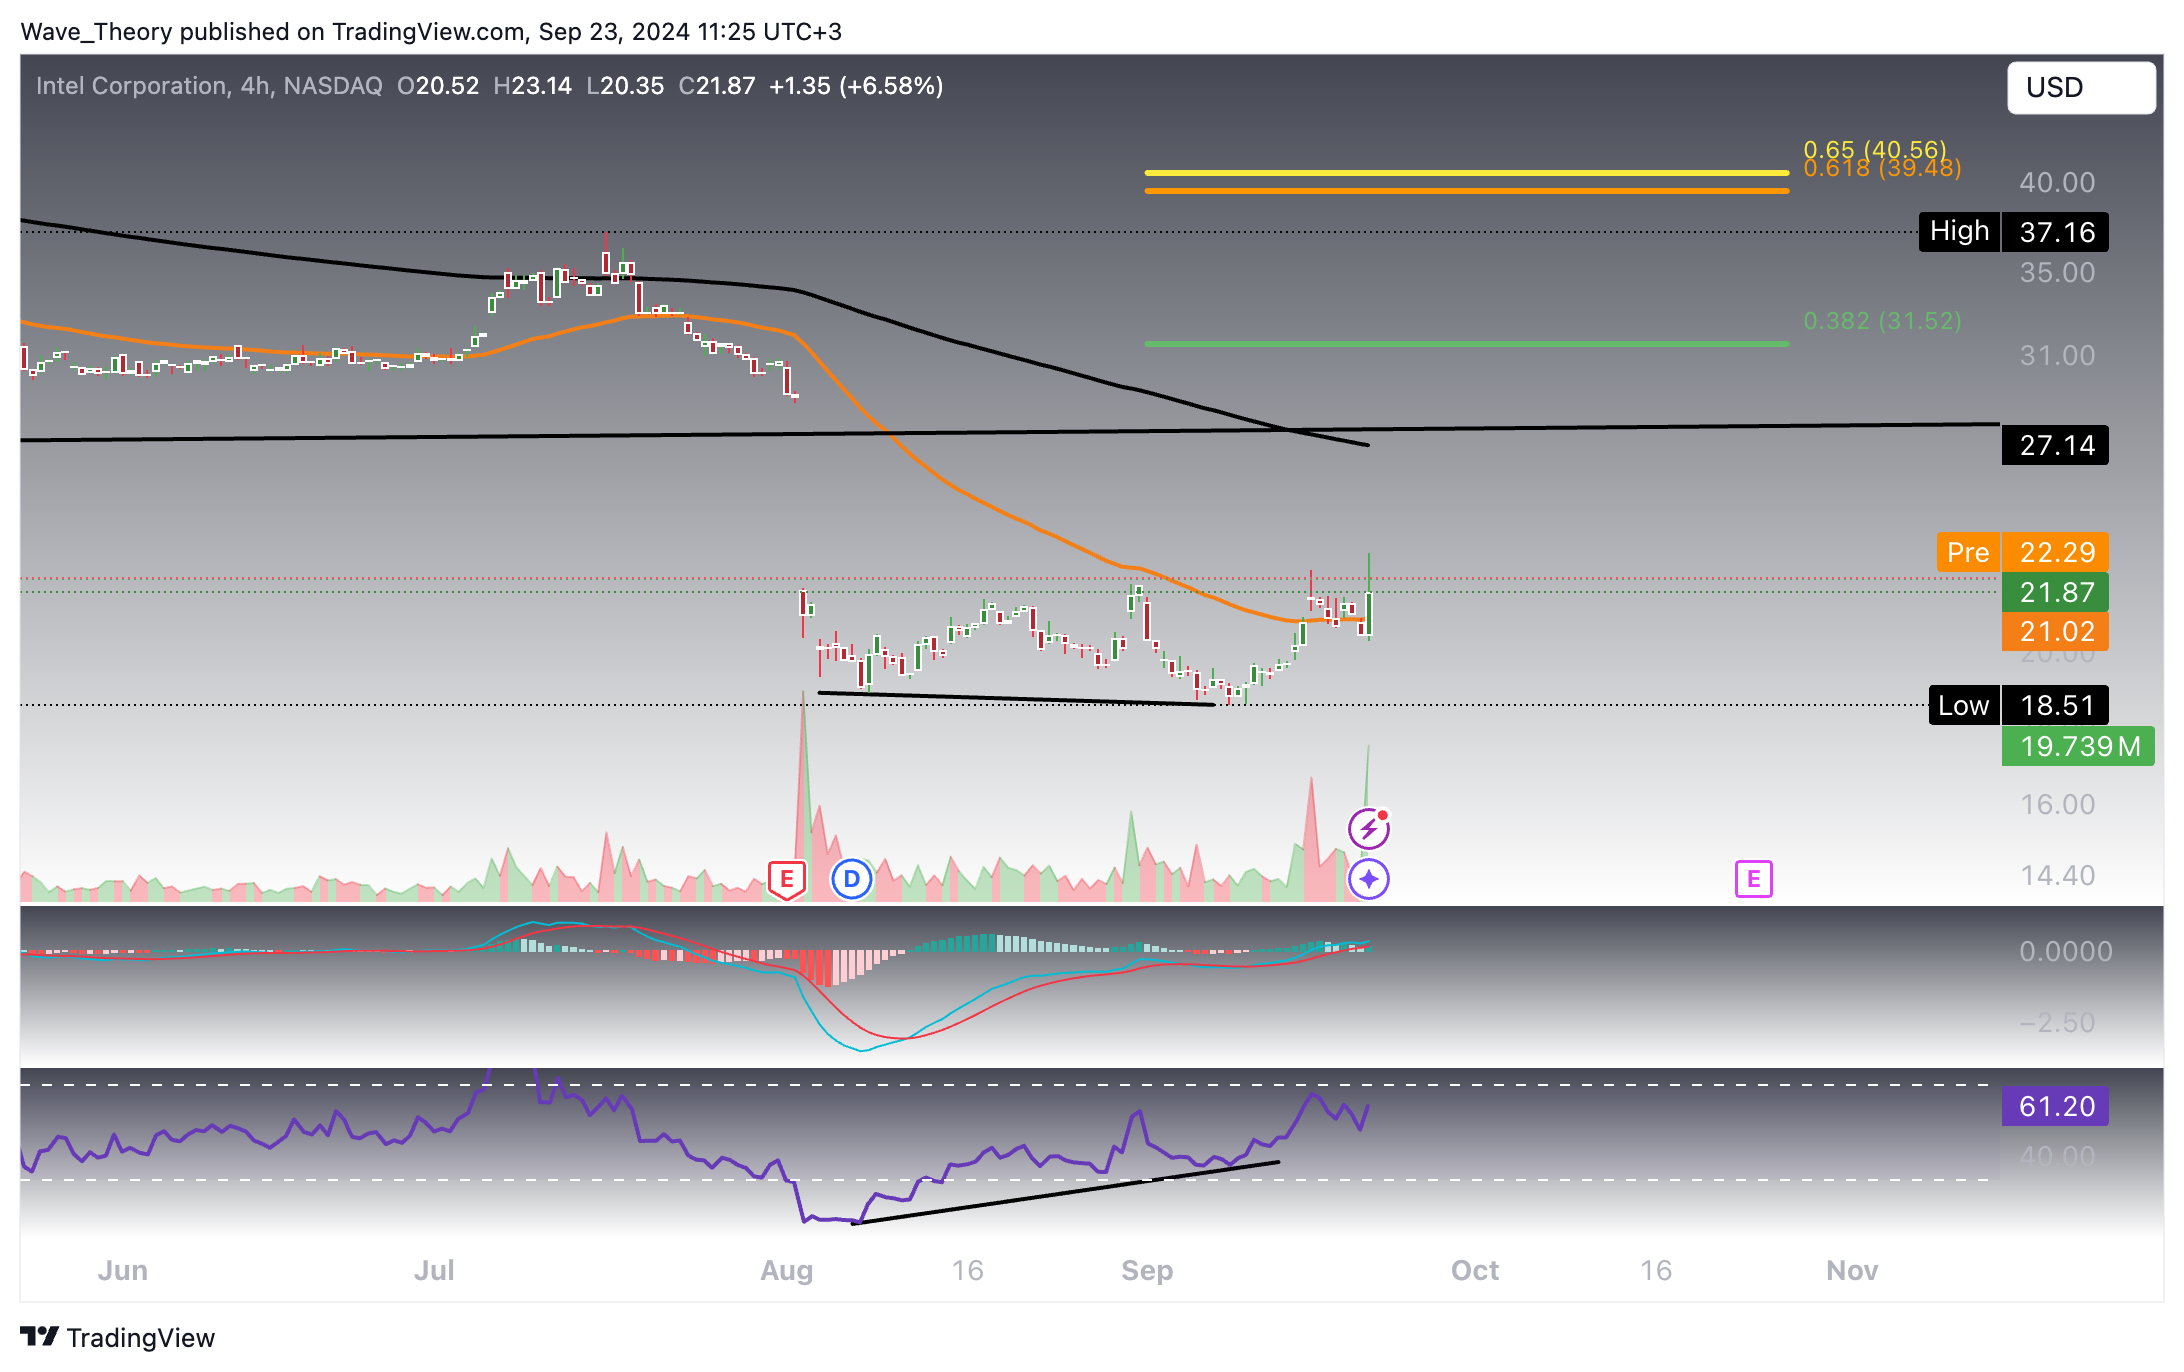
There Is More Upside In The Short-Term For Intel
In the short term, Intel has the potential to surge further, having already broken through the 50-4H EMA resistance at $21.
Technical Indicators and Trends (4H Chart):
- MACD (Moving Average Convergence Divergence): The MACD lines remain bullishly crossed, although the histogram is fluctuating between bullish and bearish ticks, indicating some volatility in momentum.
- RSI (Relative Strength Index): The RSI is approaching overbought regions, suggesting that upward momentum is building but caution may be warranted as it nears this threshold.
- EMA (Exponential Moving Average): The EMAs have formed a death cross, which confirms a bearish trend in the short term. This conflicting signal highlights the need for careful monitoring of price action.
As Intel moves forward, traders should watch for any signs of continued strength, particularly in the context of the bullish MACD setup and the impending overbought RSI conditions. However, the established death cross serves as a reminder to remain vigilant against potential corrections.
- Check out our free forex signals
- Follow the top economic events on FX Leaders economic calendar
- Trade better, discover more Forex Trading Strategies
- Open a FREE Trading Account
- Read our latest reviews on: Avatrade, Exness, HFM and XM
Related Articles

Sidebar rates
Related Posts
