Apple (AAPL) Approaches Key Support Level: Is a Rebound on the Horizon?

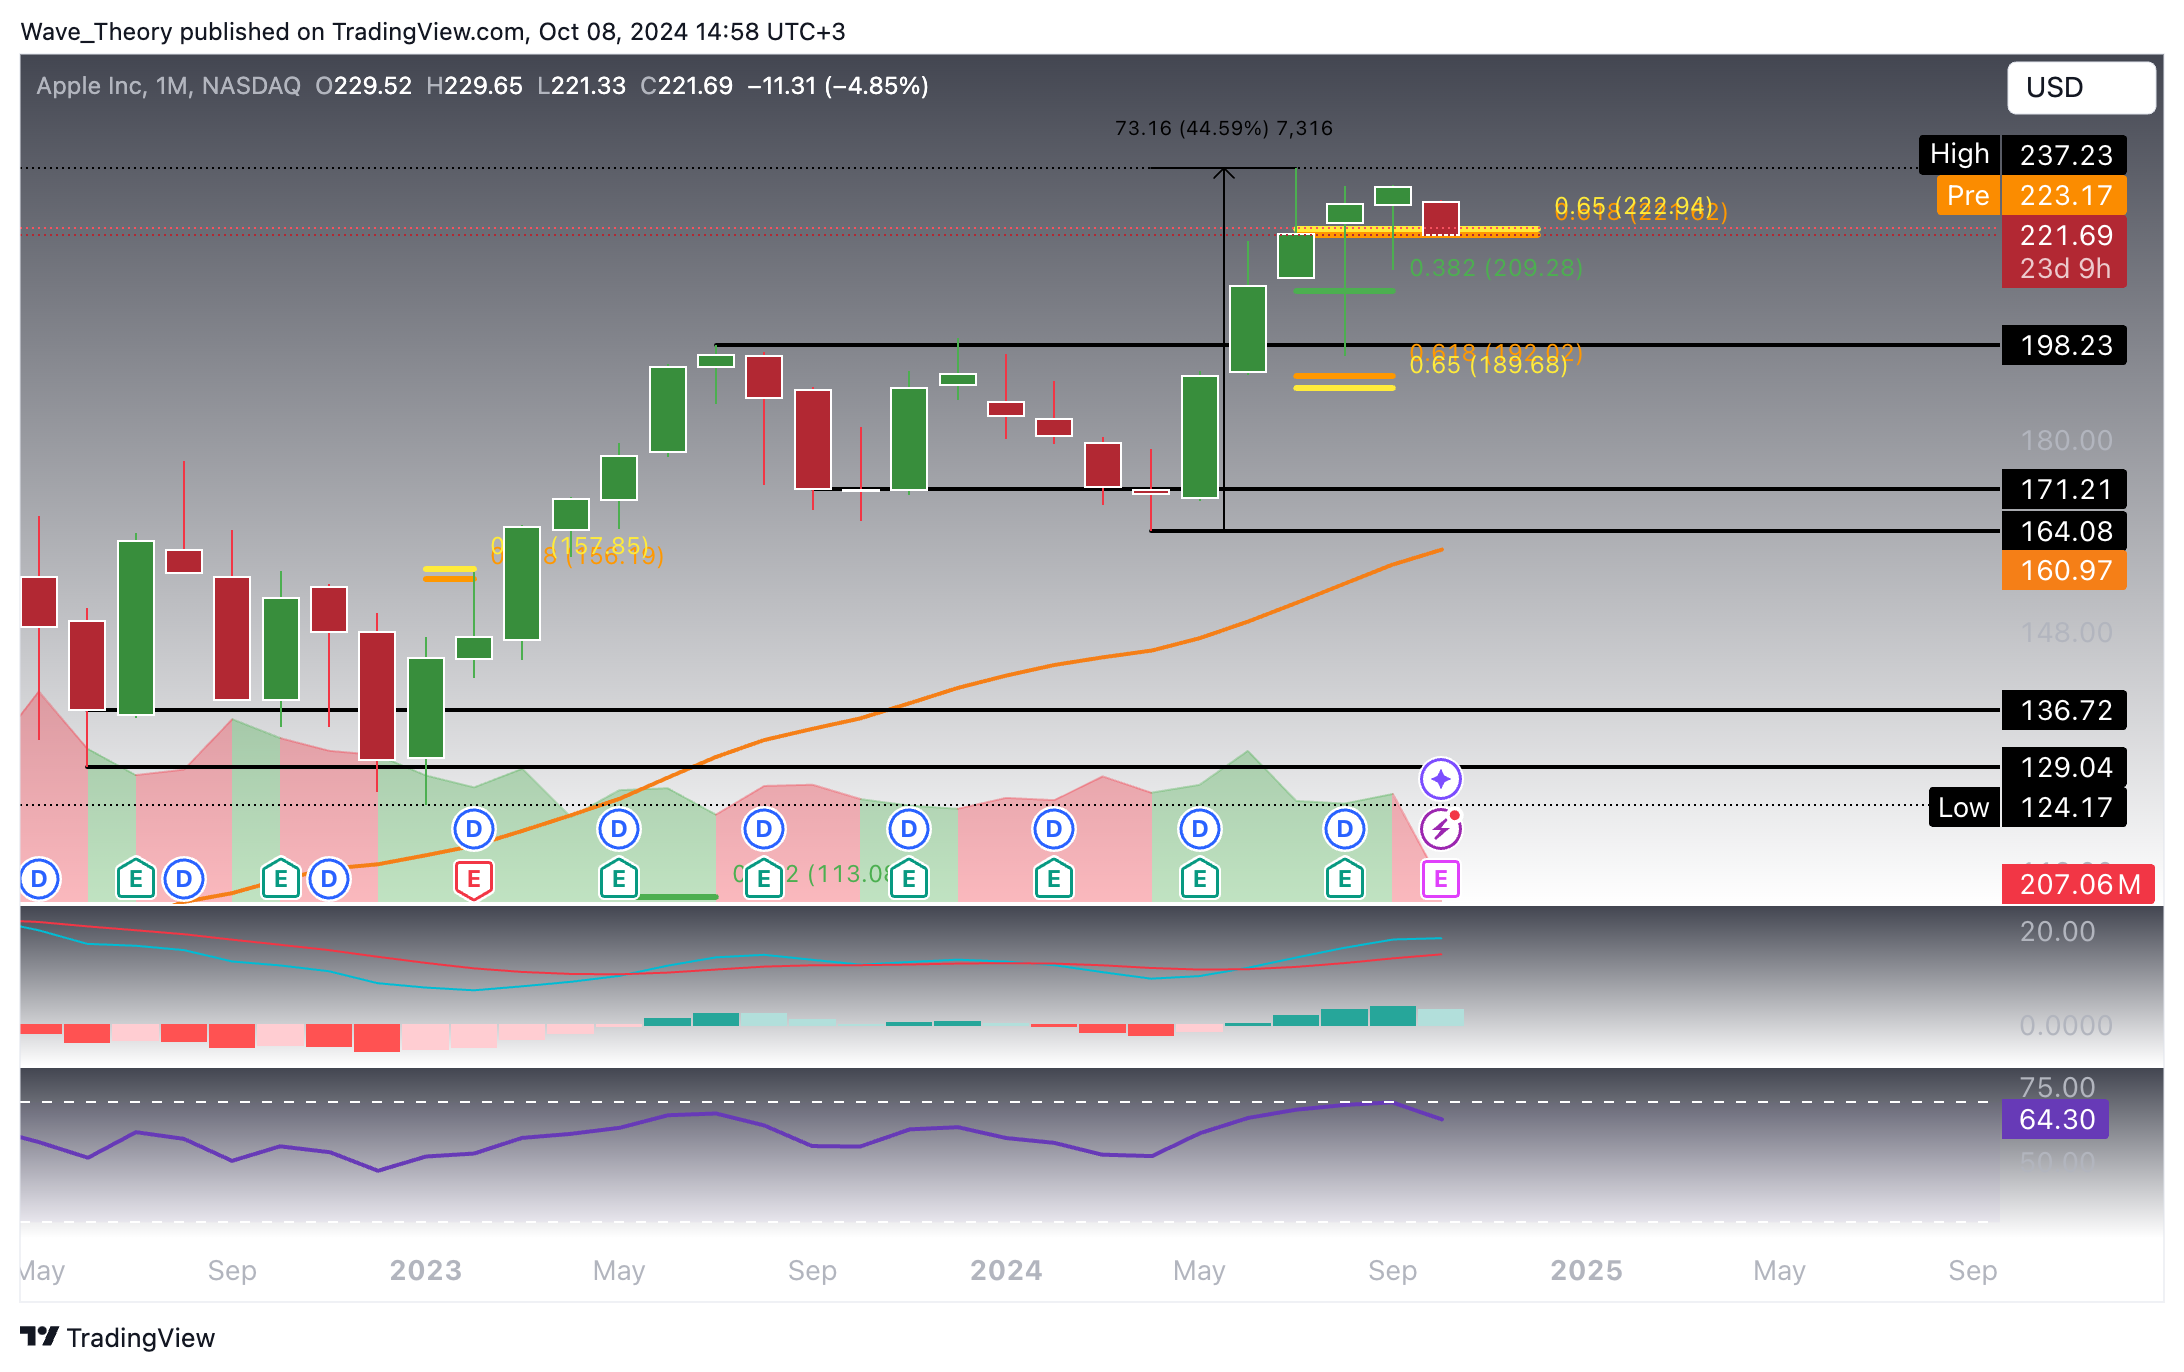
Over the past six months, Apple Inc. (AAPL) has experienced a remarkable surge of 44.6%, reaching a new all-time high (ATH) of $237.23. However, since the beginning of this month, the stock has entered a corrective phase.
Apple Approaches Critical Golden Ratio Support At $222
After trending higher for the past six months, Apple Inc. (AAPL) is currently experiencing a correction, which has brought its stock price down to $222. At this level, AAPL encounters significant golden ratio support, presenting the potential for a bullish bounce to continue its upward trajectory. Should this support fail to hold, the next critical Fibonacci support levels are located at $209 and $190.
Technical Indicators: Signals and Trends (Monthly Chart)
- MACD (Moving Average Convergence Divergence): The MACD lines have crossed bullishly; however, the histogram is beginning to show signs of a bearish shift this month.
- RSI (Relative Strength Index): The RSI recently entered overbought territory, leading to a decline in Apple’s stock price. It has now returned to neutral levels.
- EMA (Exponential Moving Average): The golden crossover of the EMAs confirms a bullish trend in the long term, reinforcing a positive outlook for the stock.

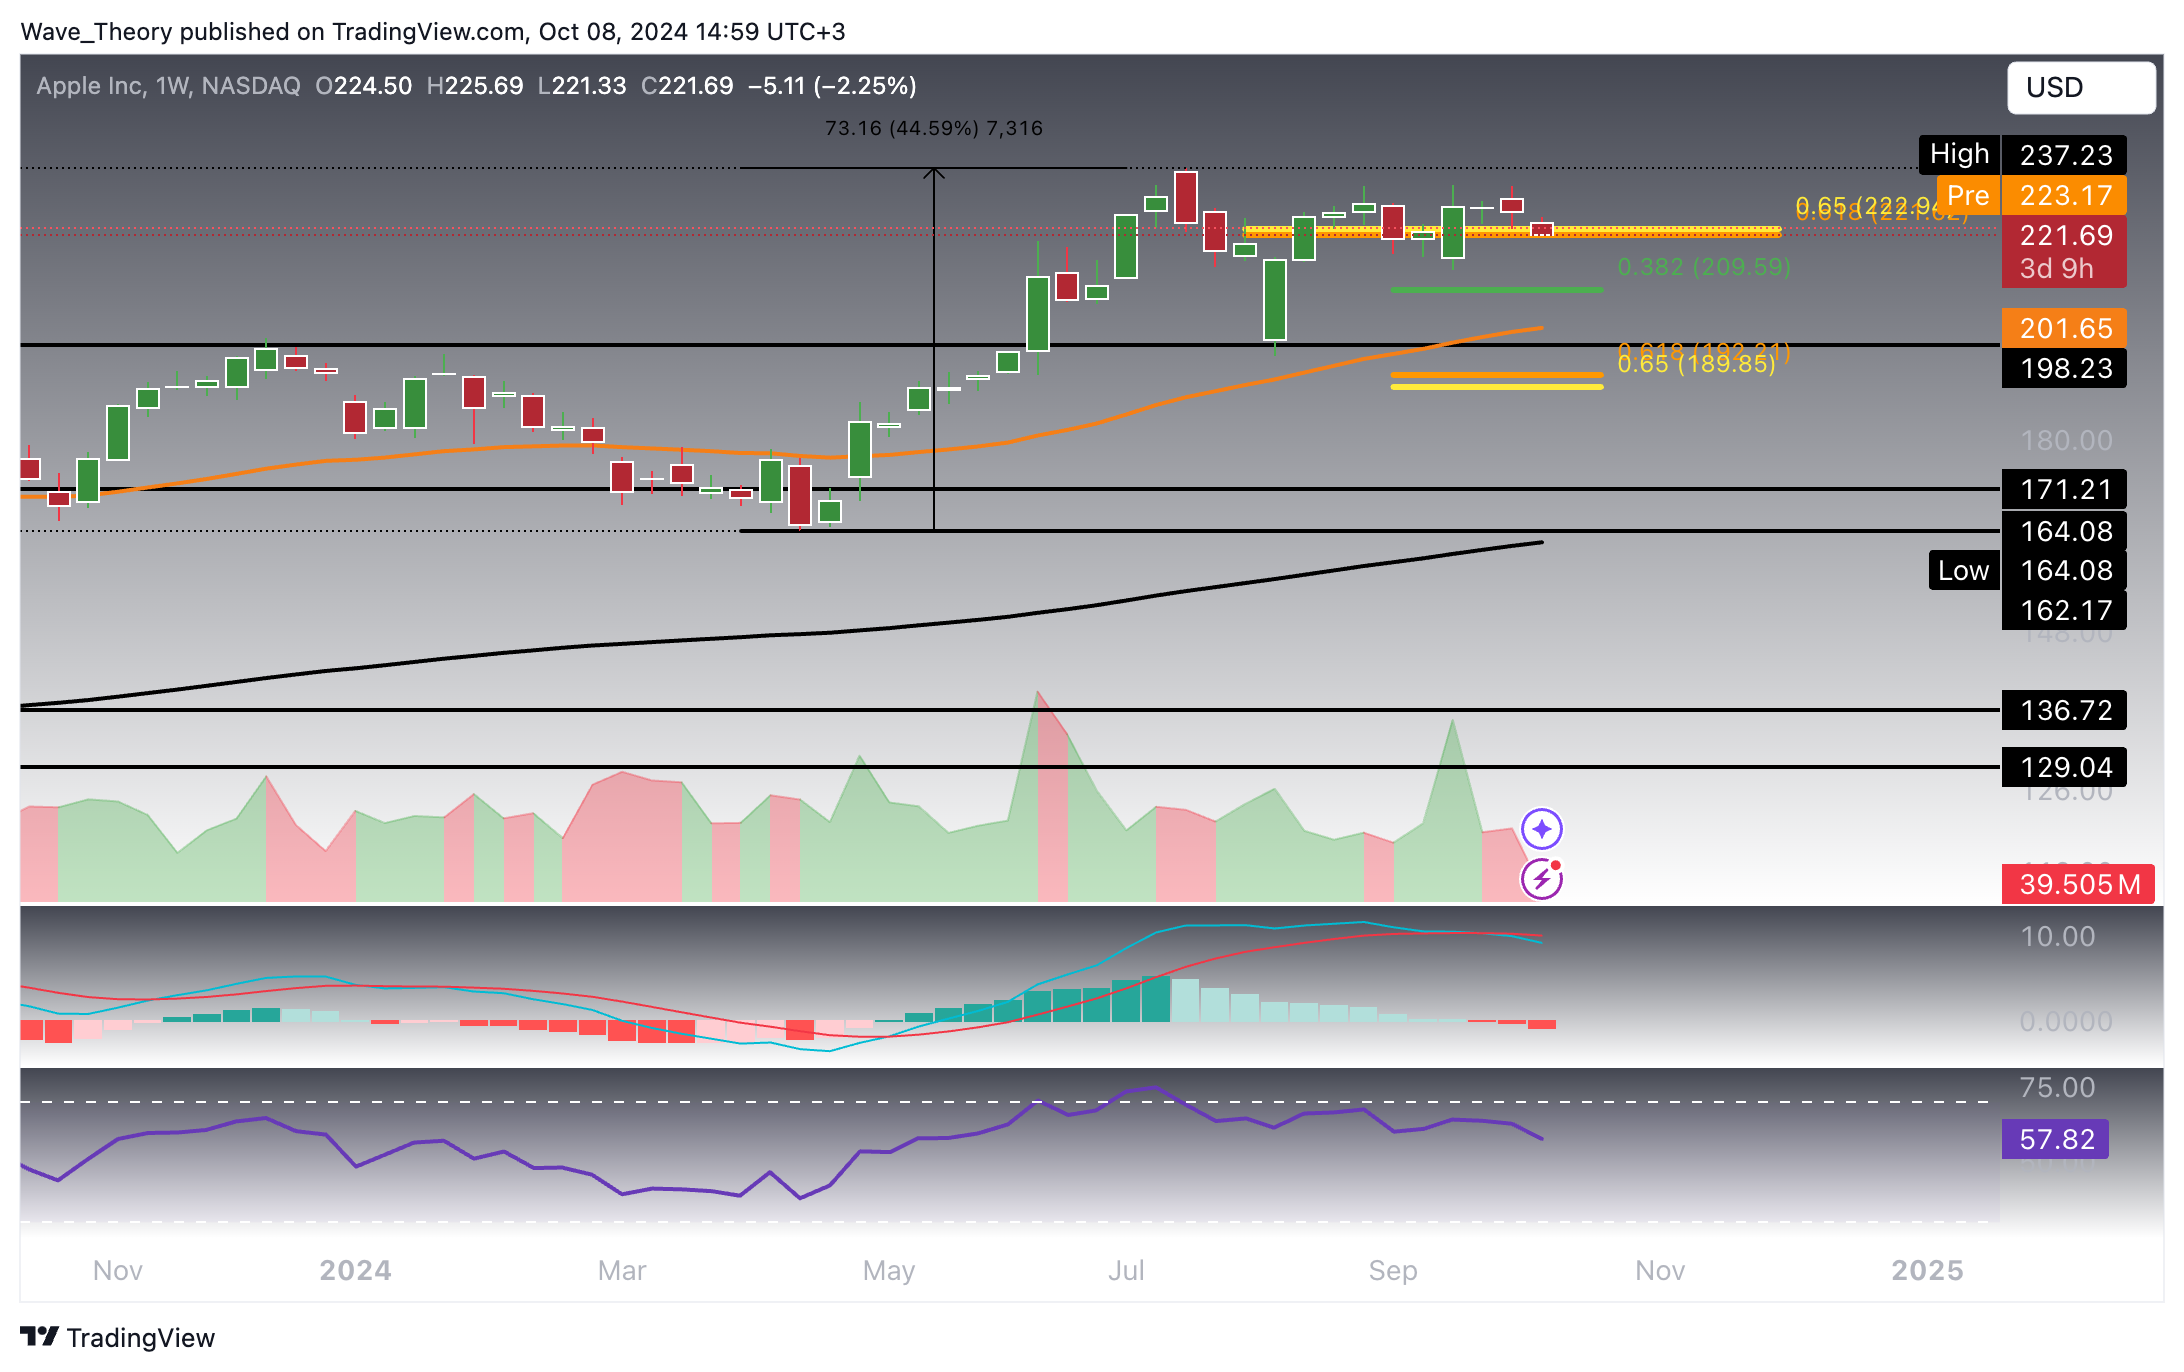
The Weekly Chart Presents a Bearish Outlook
The weekly chart reveals that Apple Inc. (AAPL) previously underwent a steep correction to the support level at $198. Although the stock rebounded strongly from this support, it failed to surpass its all-time high (ATH) of $237. Currently, the indicators are signaling a bearish trend.
Technical Indicators: Signals and Trends (Weekly Chart)
- MACD (Moving Average Convergence Divergence): The MACD lines have crossed bearishly, with the histogram reflecting a bearish trend.
- RSI (Relative Strength Index): The RSI is trending downward, moving out of overbought territory and returning to neutral levels.
- EMA (Exponential Moving Average): Despite the recent pullback, the golden crossover of the EMAs indicates a bullish trend in the mid-term, providing a generally positive outlook.
Support Levels: Apple has significant support levels at $222, $209, and between $190 and $202. Notably, the 50-week EMA at approximately $202 serves as additional support.

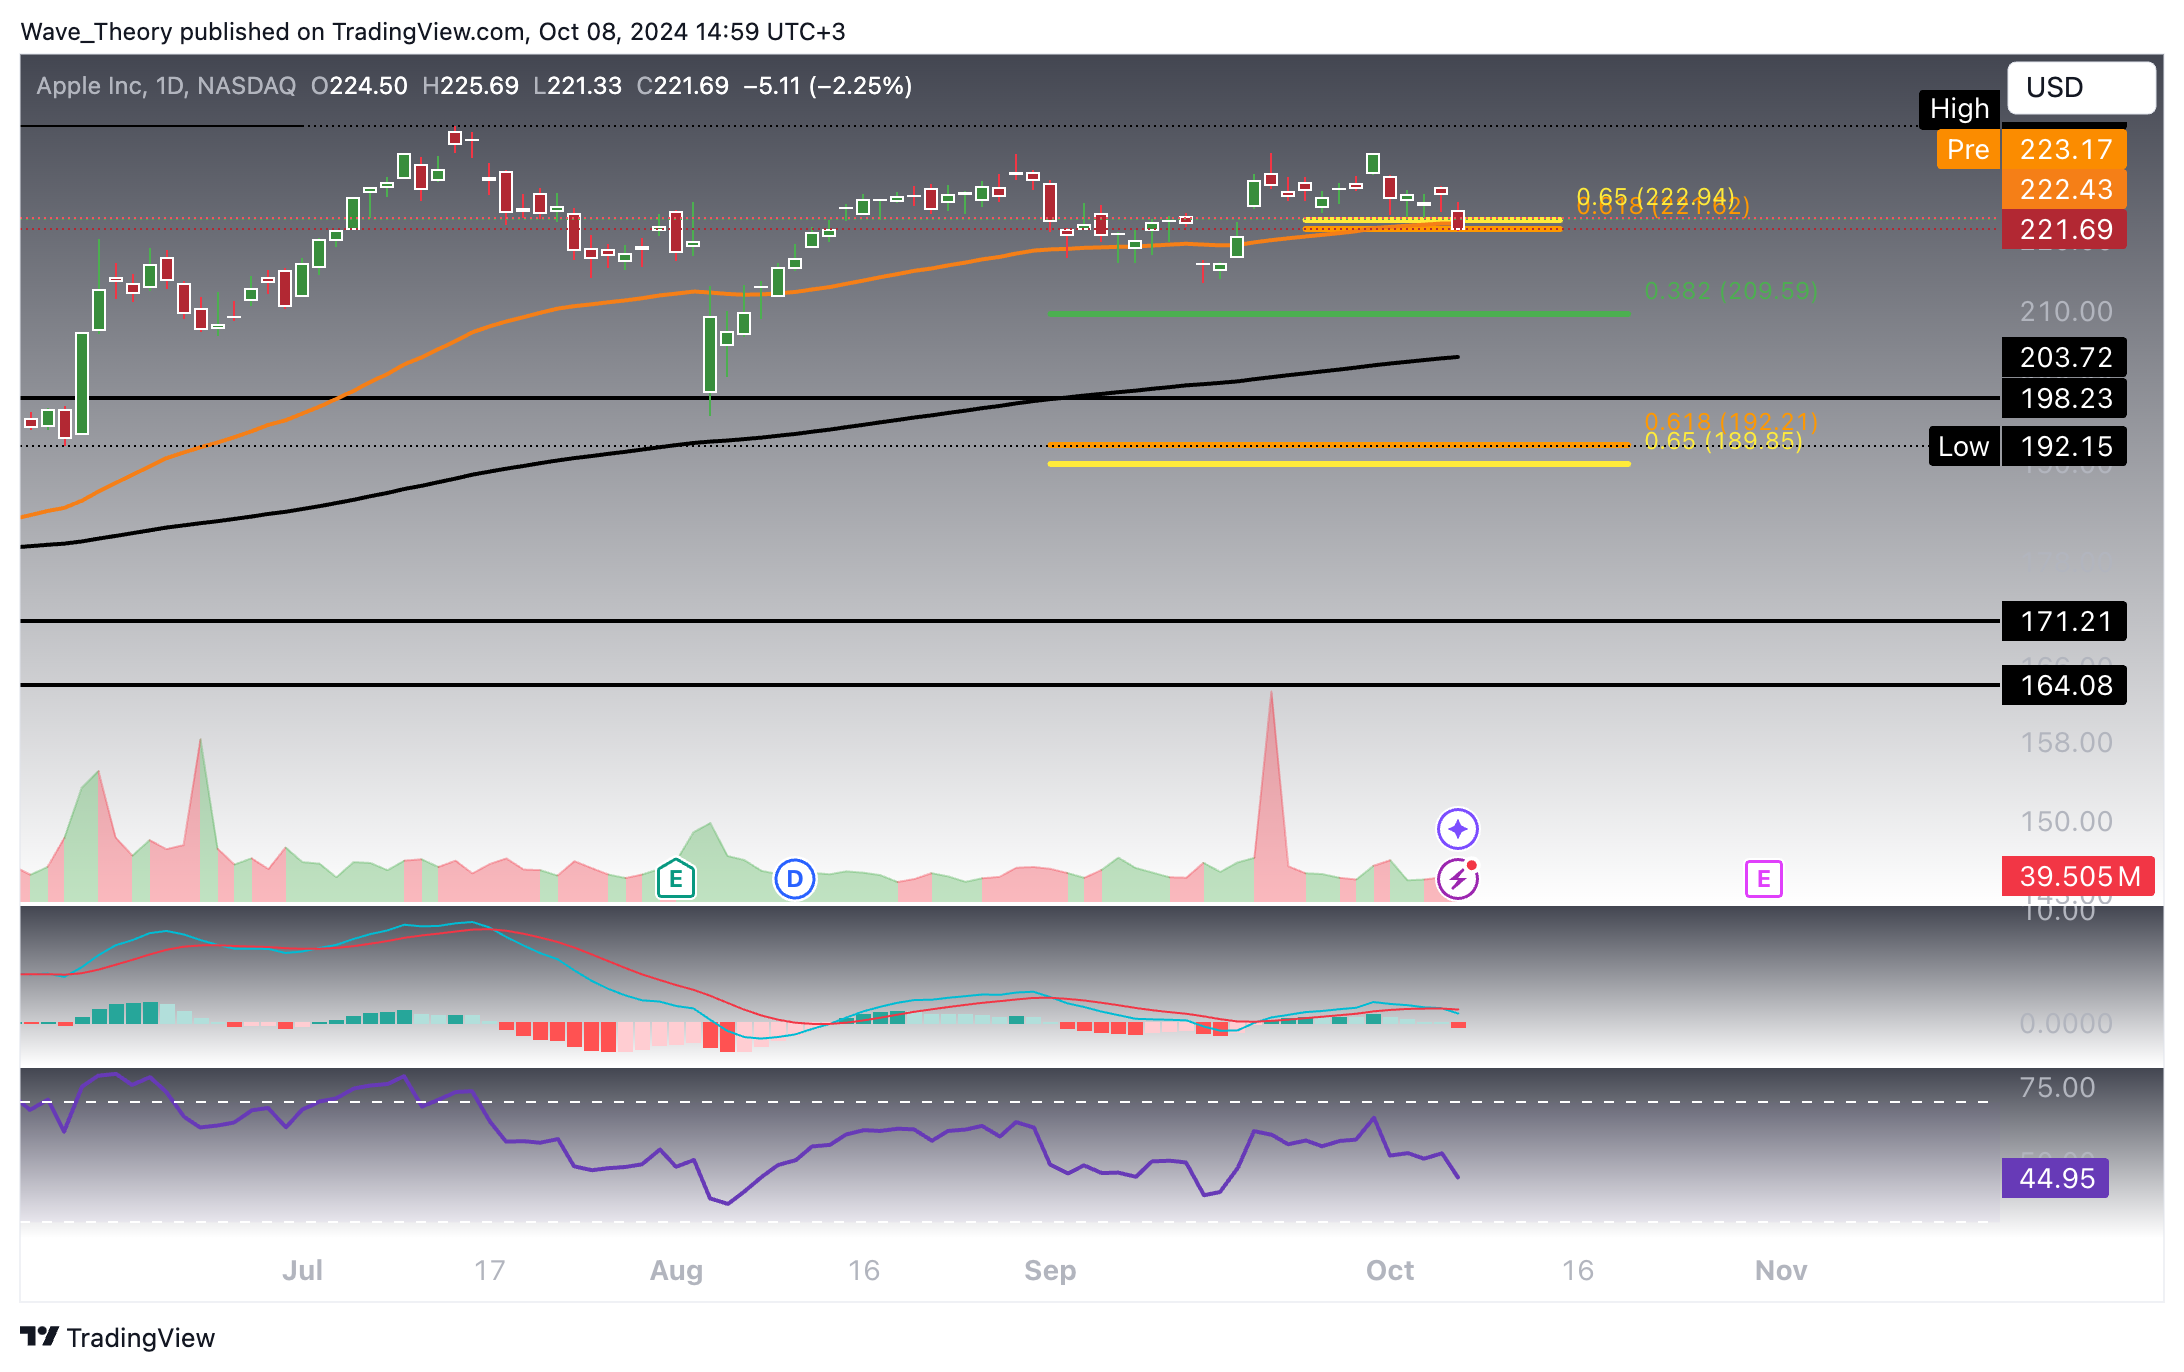
Further Downside Potential in the Daily Chart of Apple Inc. (AAPL)
The indicators on the daily chart indicate a bearish outlook for Apple stock. Nevertheless, the 50-day EMA provides additional support at the critical golden ratio level of $222.
Technical Indicators: Signals and Trends (Daily Chart)
- MACD (Moving Average Convergence Divergence): The MACD is currently in a bearish crossover, with the histogram trending downward over the past few days.
- RSI (Relative Strength Index): The RSI remains in neutral territory, indicating no strong directional bias at this time.
- EMA (Exponential Moving Average): The golden crossover of the EMAs supports a bullish trend in the short-to-mid term, suggesting a generally positive outlook despite the recent pullbacks.
 Apple
Apple
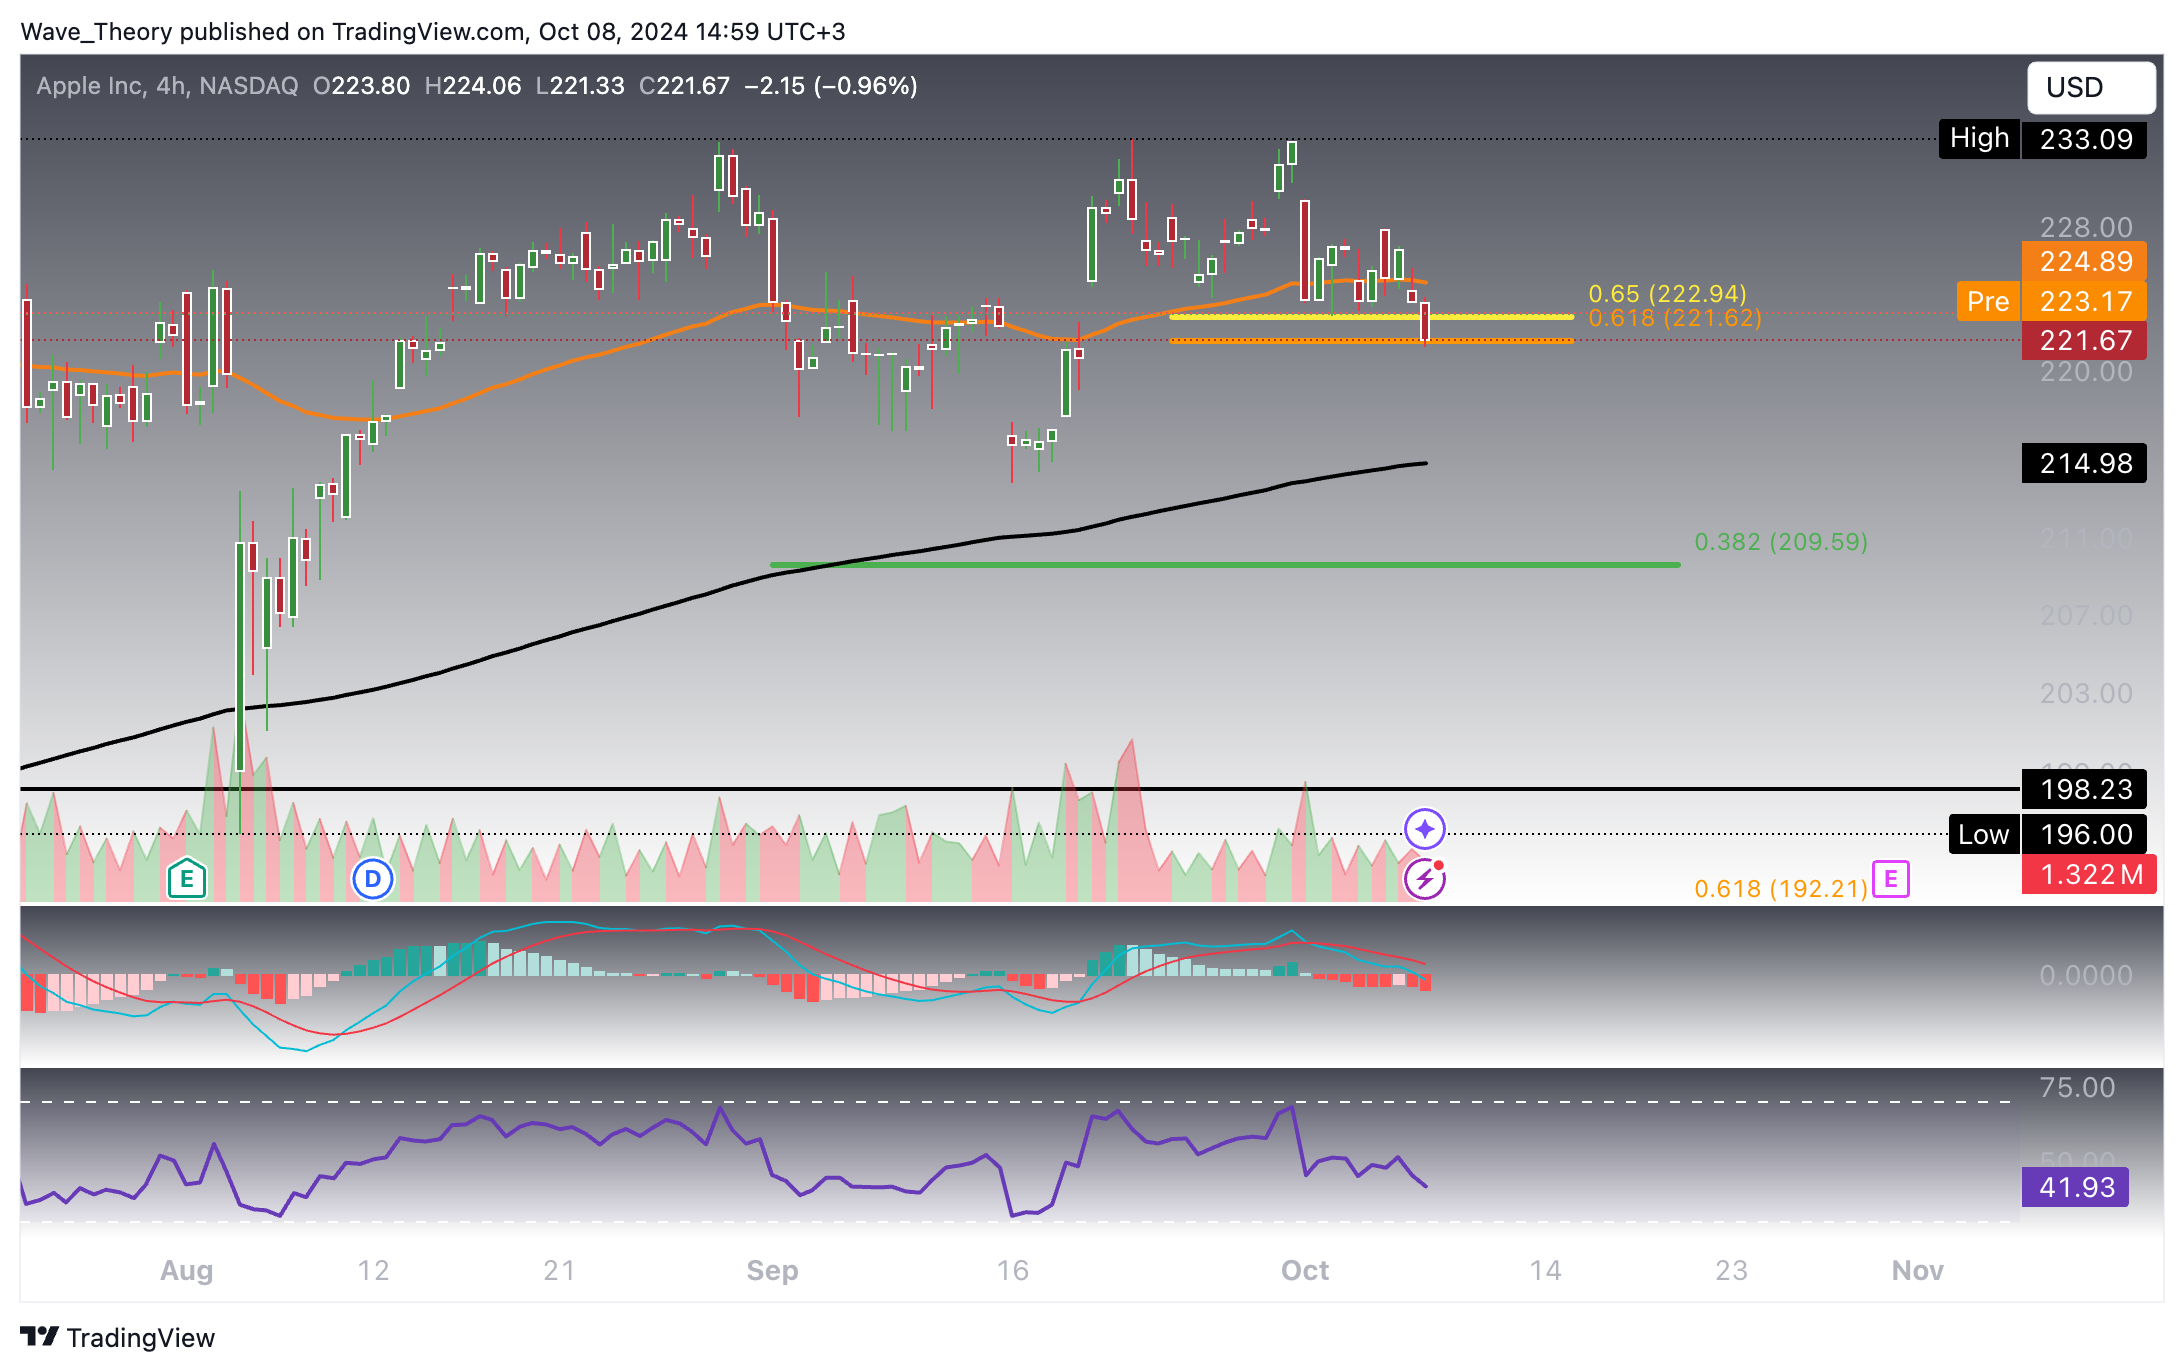
Apple Could Potentially Break The Golden Ratio Support
Apple Inc. (AAPL) is nearing a critical point, with the golden ratio support at $222 under threat of being broken. A break below this level could lead to a correction toward the next Fibonacci level at $209.6. However, the 200-4H EMA offers additional support at $215, which may help stabilize the stock.
Technical Indicators: Signals and Trends (4-Hour Chart)
- MACD (Moving Average Convergence Divergence): The MACD lines have crossed bearishly, and the histogram is trending lower, indicating increasing bearish momentum.
- RSI (Relative Strength Index): The RSI remains neutral, providing no clear directional bias at this time.
- EMA (Exponential Moving Average): The golden crossover of the EMAs continues to confirm a bullish trend in the short term, supporting the potential for further gains.

Apple Inc. (AAPL) has experienced significant price movements over various time frames. In the last six months, the stock surged by 44.6% to an all-time high of $237.23 but is now facing a corrective phase, currently testing crucial support levels. The weekly chart presents a bearish outlook, with significant support at $222 and Fibonacci levels at $209 and $190. Meanwhile, the daily chart shows bearish indicators, although the 50-day EMA at $222 provides critical support. On the 4-hour chart, AAPL is on the verge of breaking the golden ratio support at $222, which could lead to a correction toward $209.6, although the 200-4H EMA at $215 may offer additional support. Overall, while some bullish indicators remain, the prevailing sentiment leans bearish across multiple time frames.
- Check out our free forex signals
- Follow the top economic events on FX Leaders economic calendar
- Trade better, discover more Forex Trading Strategies
- Open a FREE Trading Account


