GameStop Corp. (GME): Is There More Upside In This Rallye?

Our last analysis on GameStop (GME) indicated a bullish outlook when the stock was priced at $23. Today, GME sits at $29, marking a substantial increase. Is there more room for upside?
GameStop (GME) Stock: Bullish Outbreak
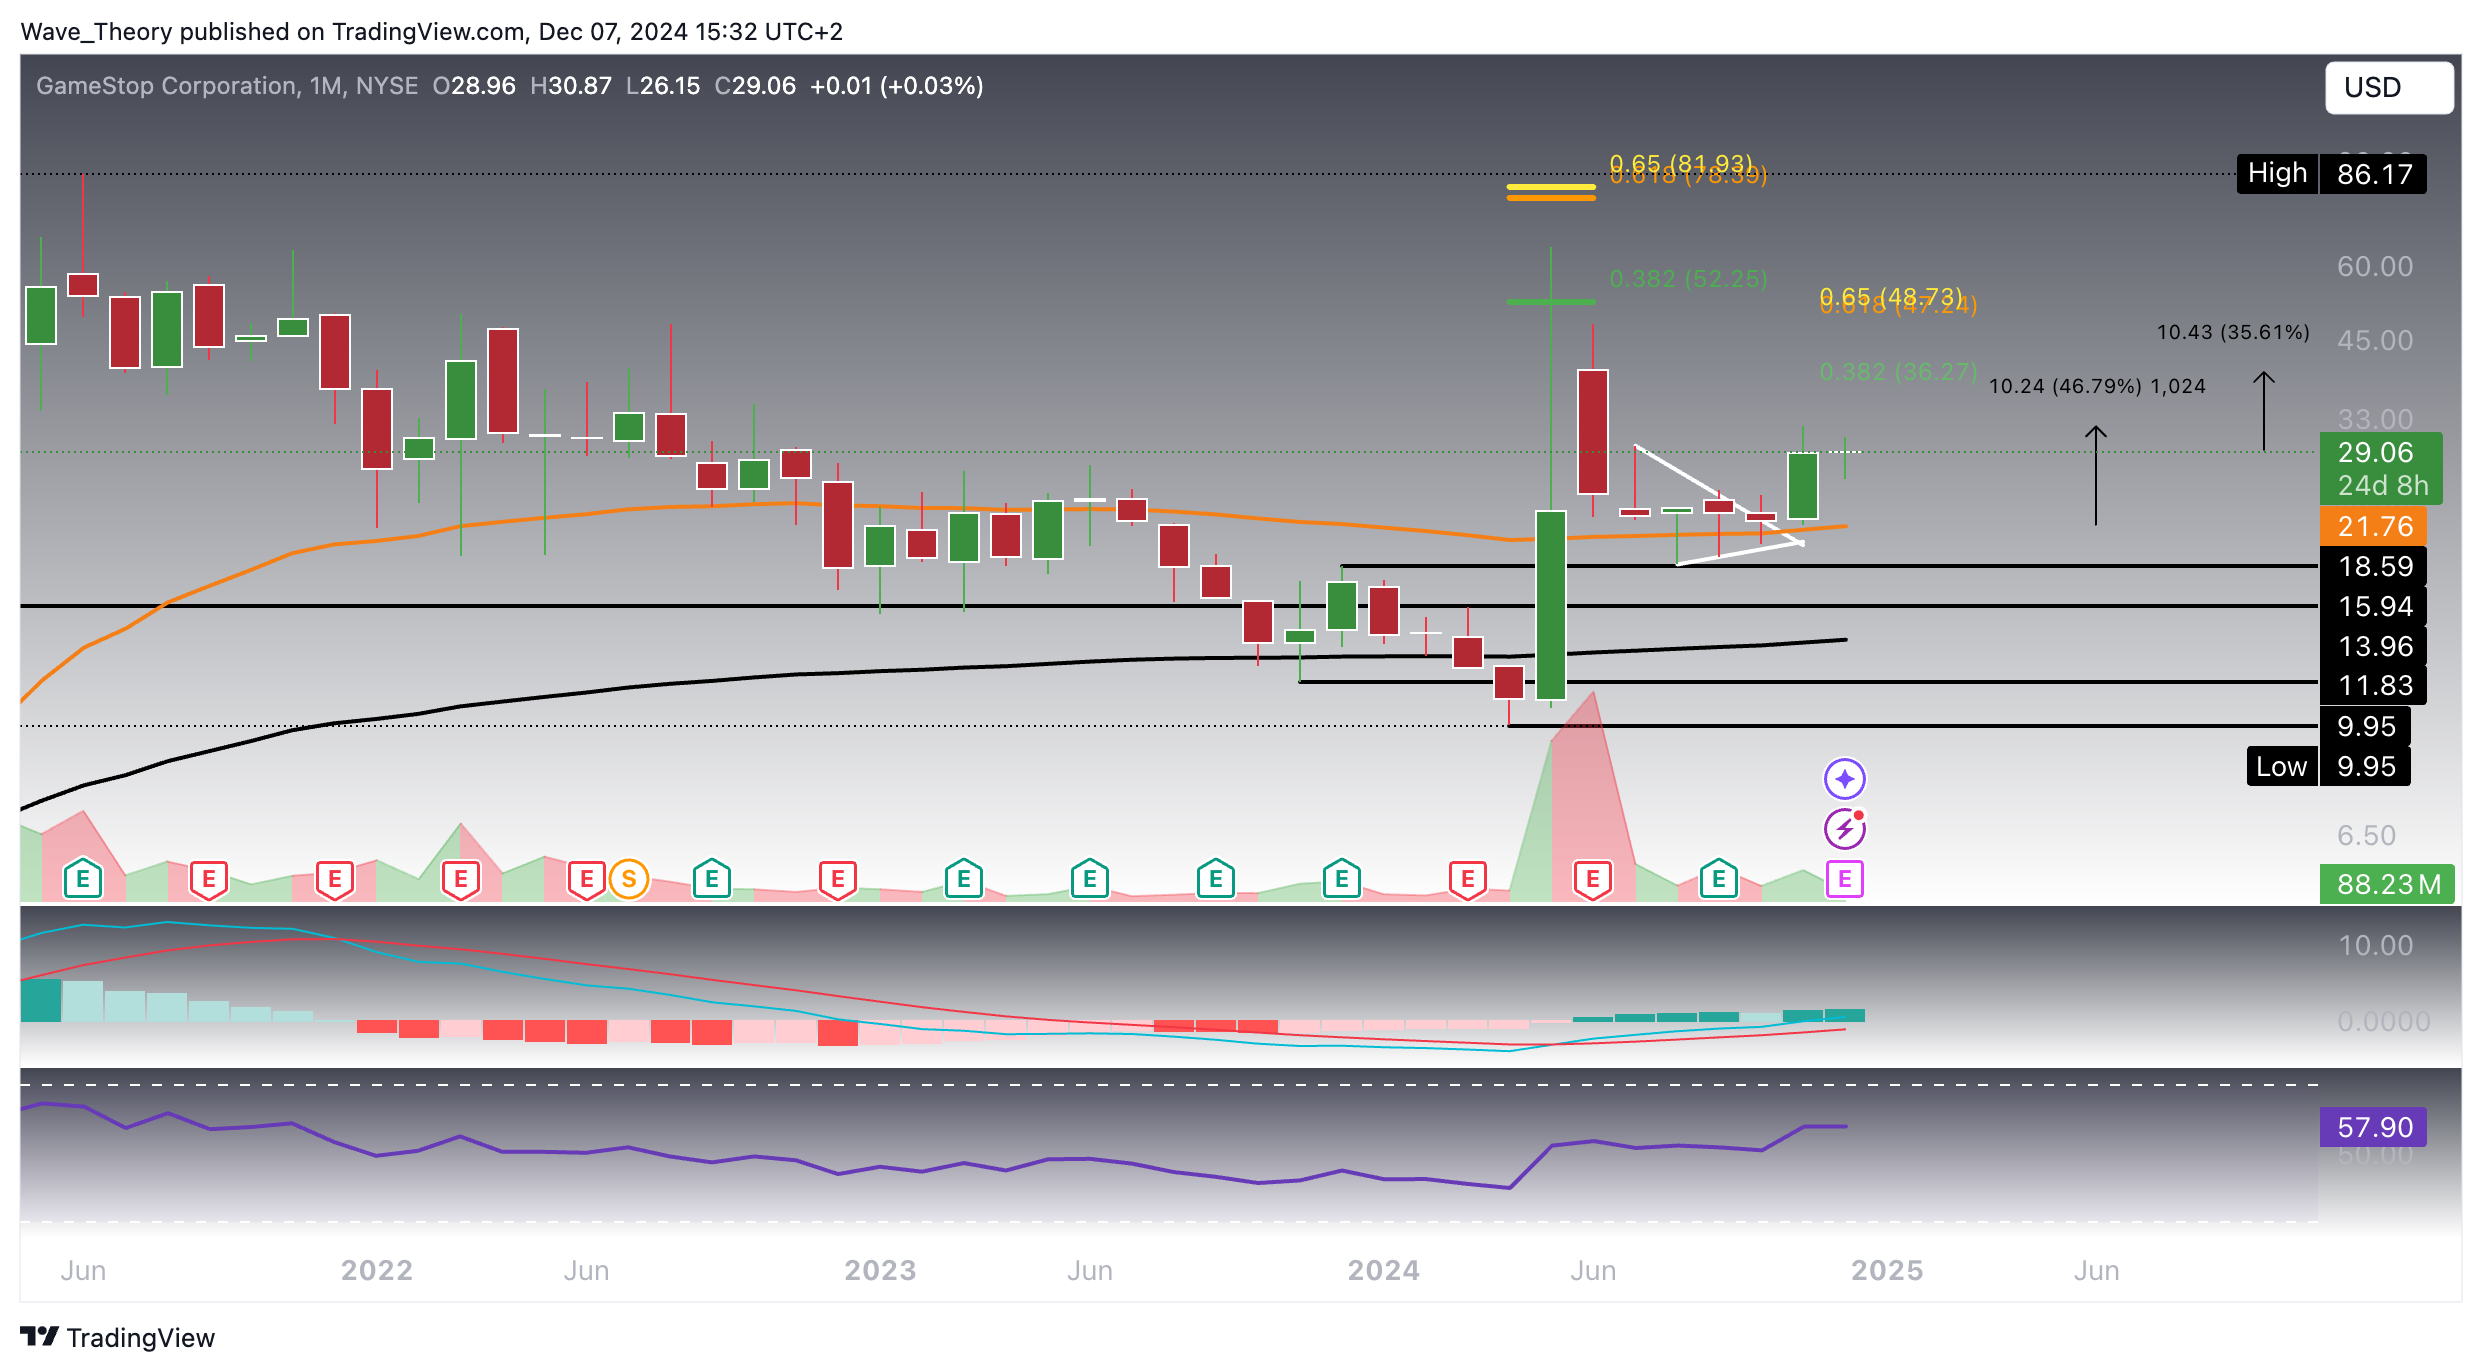
In the past month, GME has demonstrated impressive growth, breaking out of a symmetrical triangle and surging by nearly 47%. Crucially, it has held above the 50-month EMA at $21.76, indicating strength and the potential for continued upward momentum. The next key Fibonacci resistance lies at $36.27, suggesting further upside potential of approximately 26%.
Key Technical Indicators (Monthly Chart)
- MACD: The MACD lines remain bullishly crossed, and the histogram has begun ticking higher, signaling growing bullish momentum.
- RSI: The RSI remains neutral, neither overbought nor oversold, suggesting there is room for continued price appreciation.
- EMAs: The golden cross of the EMAs confirms that a longer-term bullish trend is intact. As long as GME remains above the 50-month EMA, the stock retains significant upside potential.
In summary, with the technical indicators supporting further gains, GameStop looks primed for more upside, with $36.27 as the next key target for bullish investors.
Golden Crossover on the Weekly Chart Confirms Mid-Term Bullish Trend
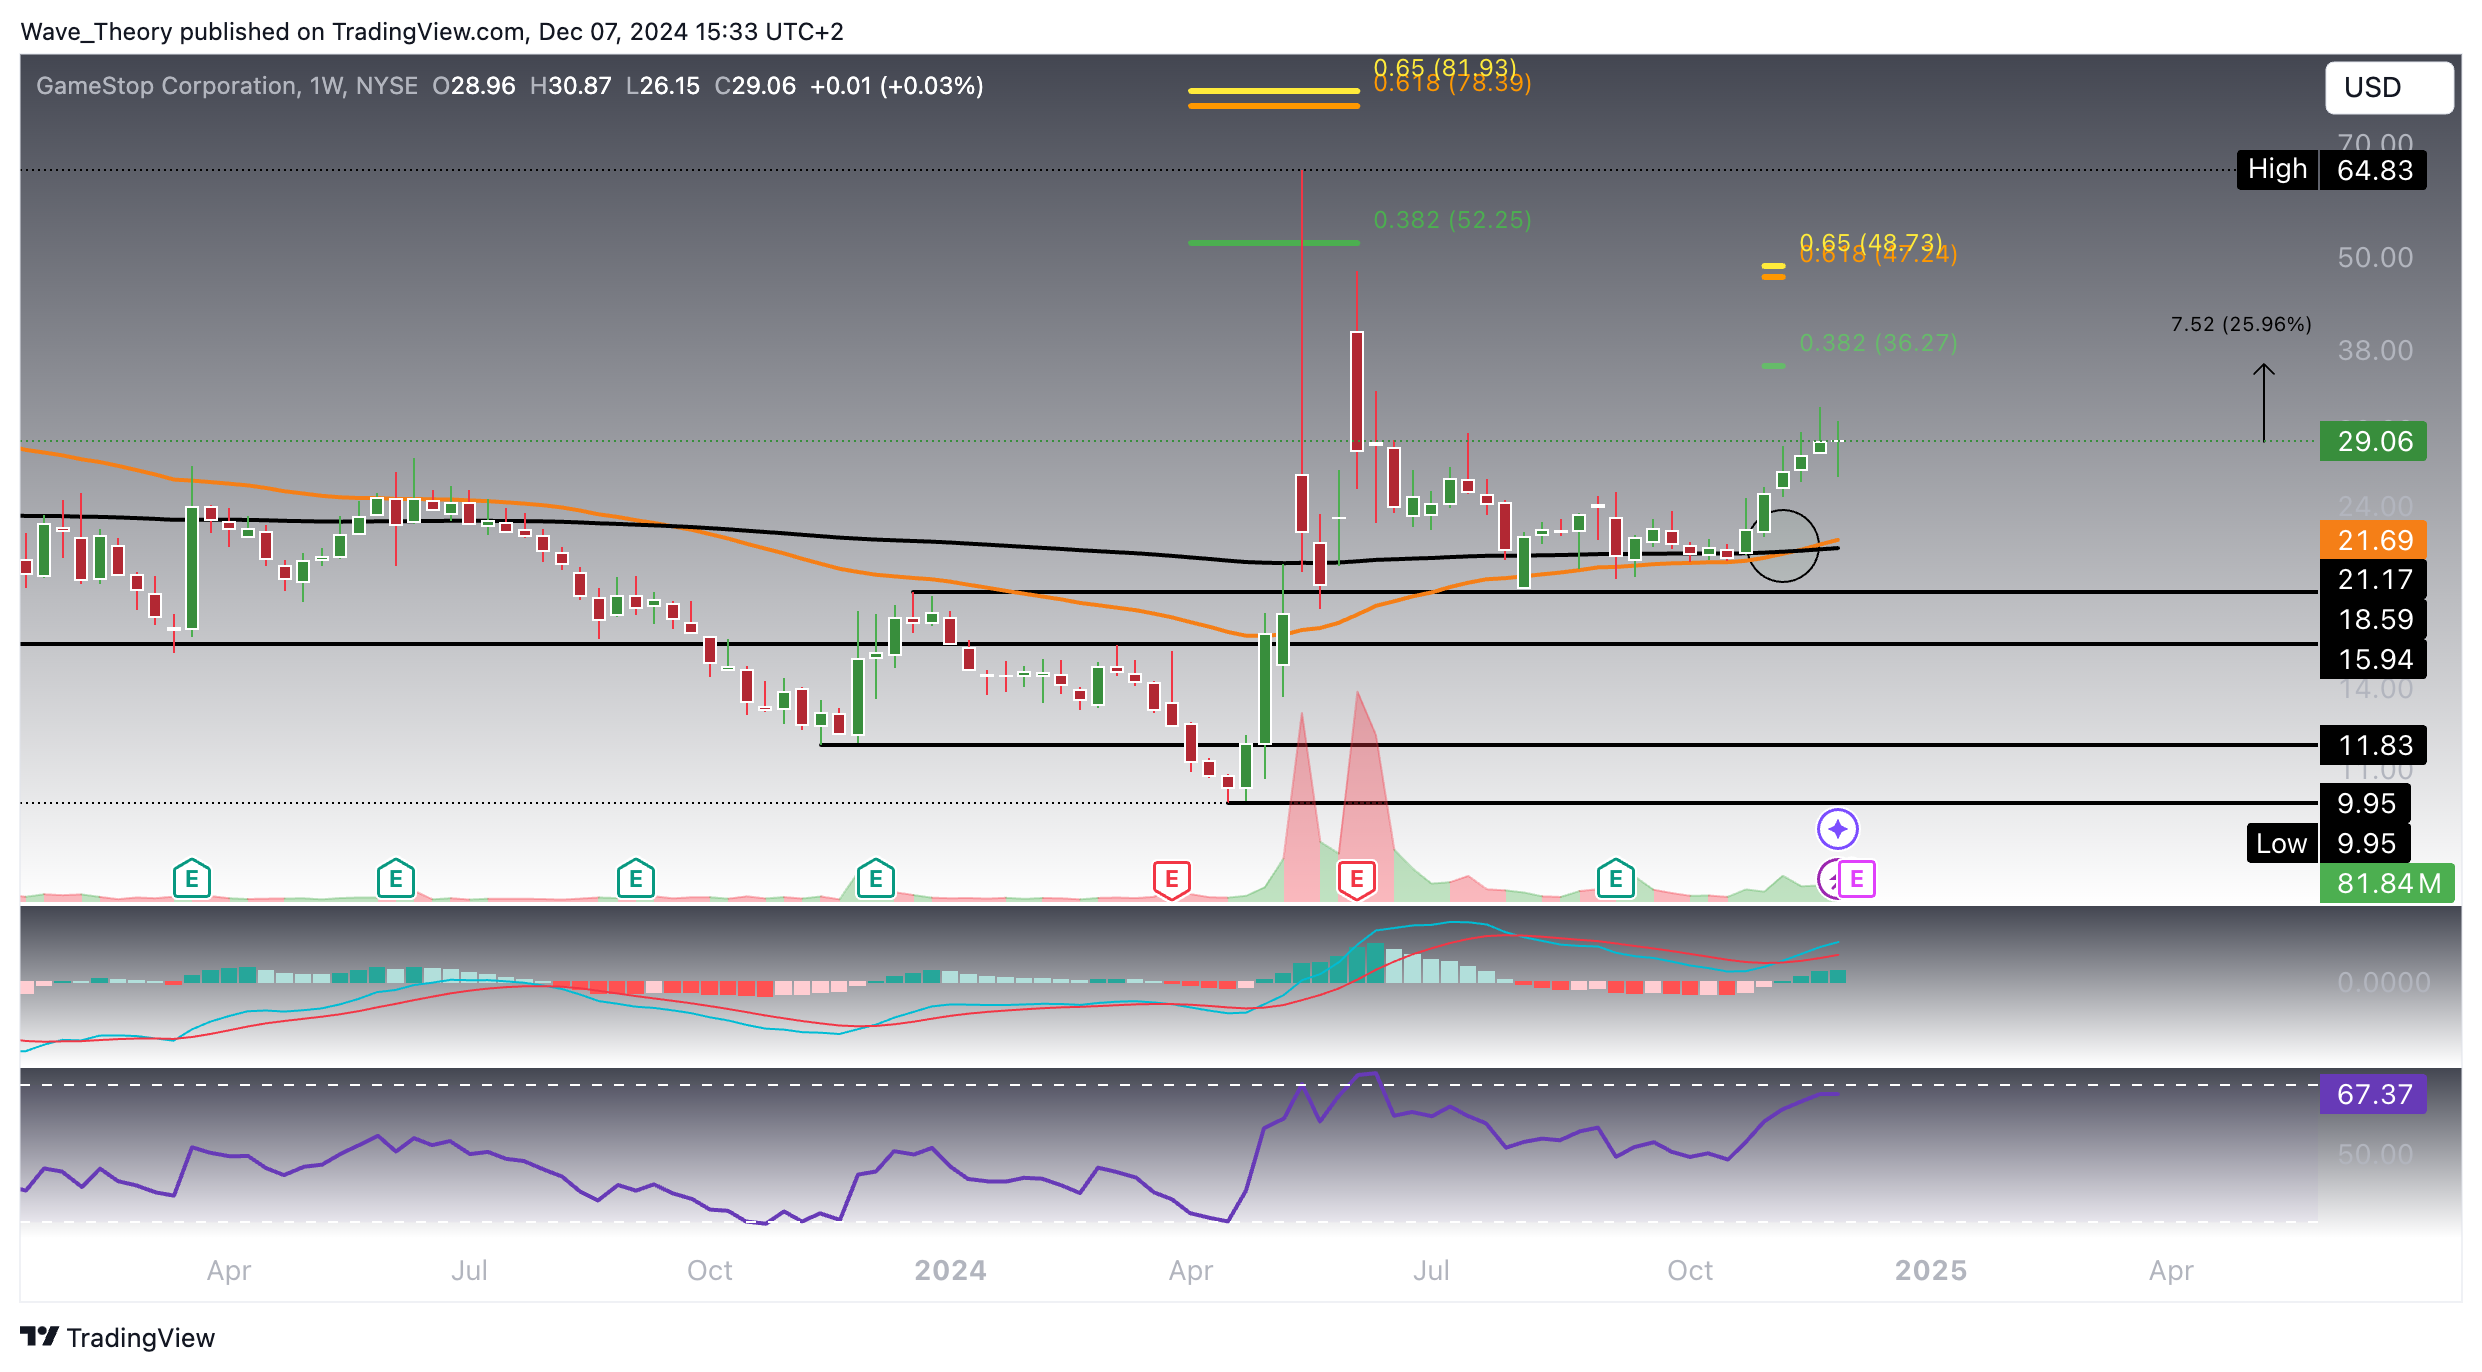
A golden crossover has emerged on the weekly chart, signaling a bullish confirmation for GameStop in the mid-term. Supporting this outlook, the MACD lines have crossed bullishly, and the histogram shows a positive trend, further reinforcing upward momentum.
Although the RSI is approaching overbought territory, it hasn’t flashed any bearish signals, suggesting there may still be room for more gains on the weekly chart. If GameStop manages to break the 0.382 Fib resistance at $36.27, it could potentially surge toward the next key level—the golden ratio at $48.
With the combination of bullish signals and the potential for further breakout, GameStop presents an attractive opportunity for mid-term gains.
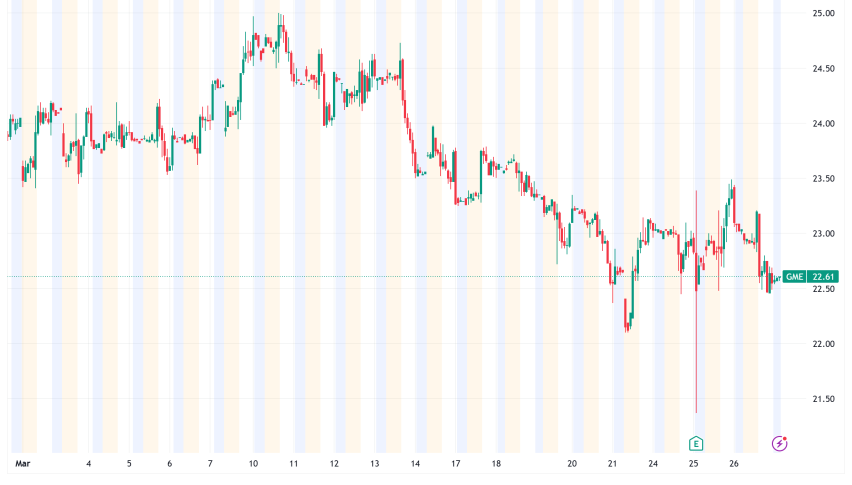
Daily Chart for GameStop (GME) Shows Mixed Signals
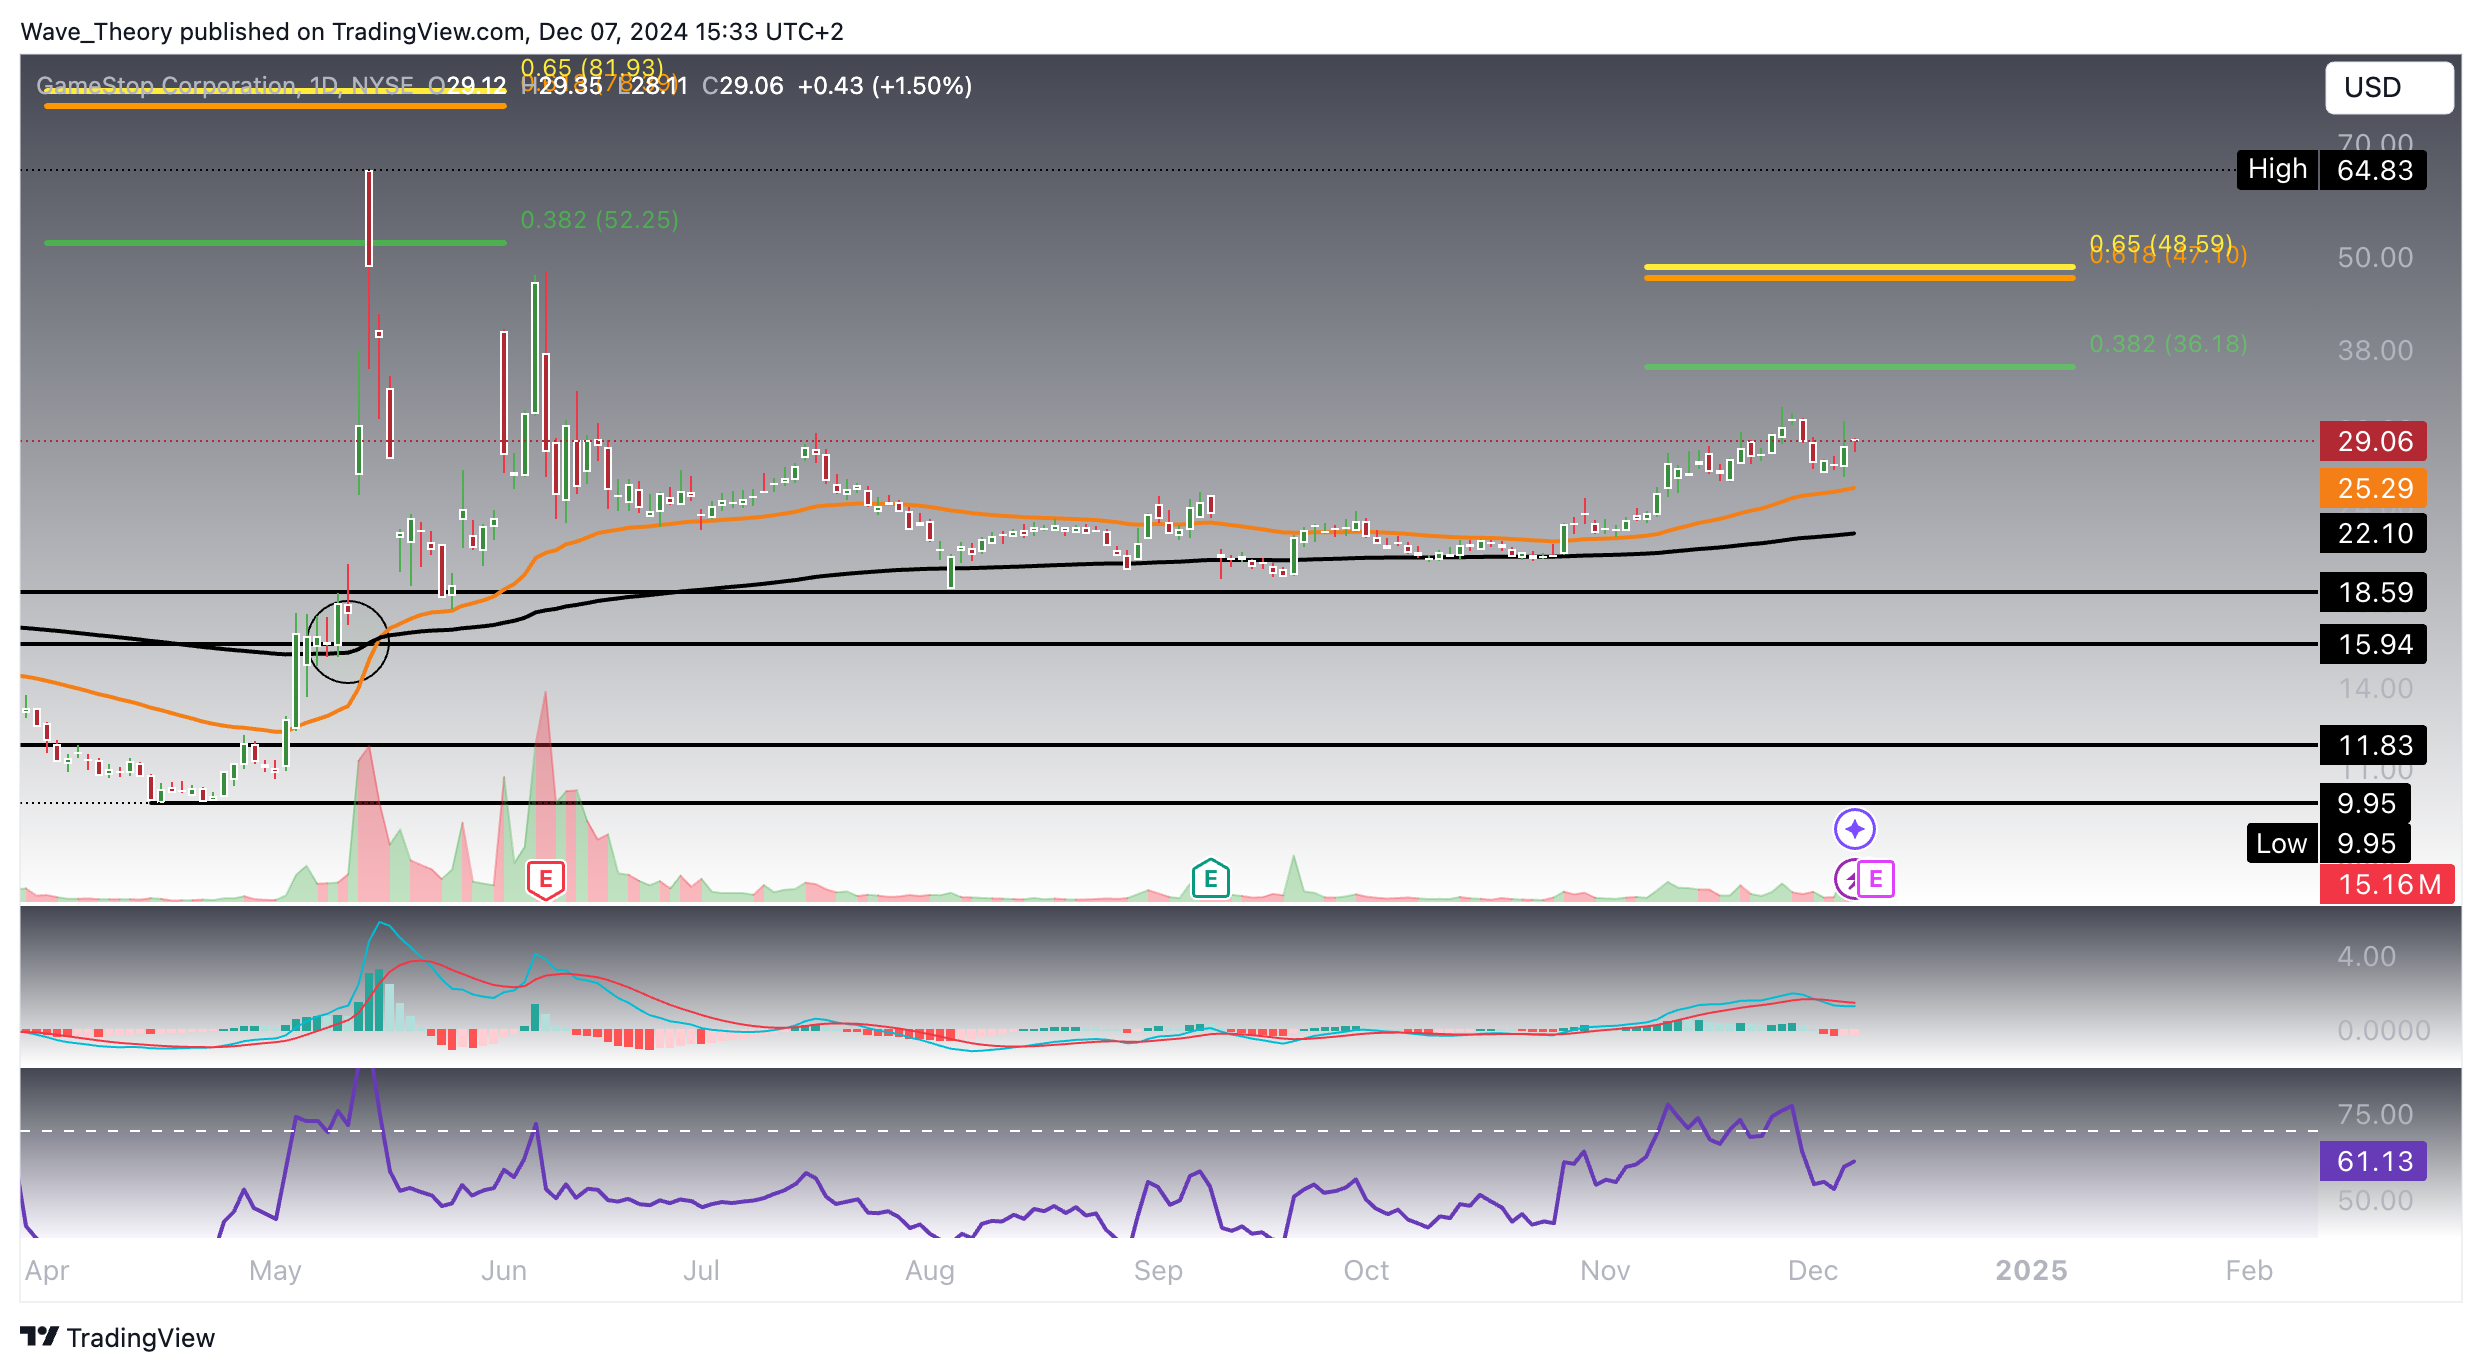
On the daily chart, GameStop presents a blend of signals, reflecting some uncertainty in the short term:
- EMAs: The EMAs continue to affirm the bullish trend in the short- to medium-term, supporting upward momentum.
- MACD: However, the MACD lines recently crossed bearishly, indicating a potential slowdown or pullback in the immediate future.
- MACD Histogram: Despite the bearish MACD cross, the histogram is ticking higher, suggesting the possibility of renewed bullish strength.
- RSI: The RSI is oscillating in neutral territory, neither overbought nor oversold, leaving room for the price to move in either direction.
In conclusion, while the overall trend remains positive, caution is advised due to the mixed signals, especially with the bearish MACD cross. Traders should monitor the indicators closely for clearer direction.
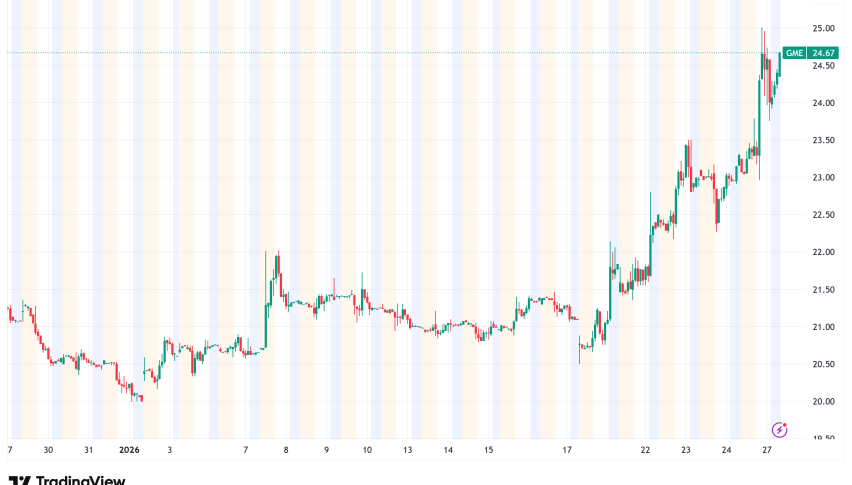
Next Critical Support Levels For GameStop
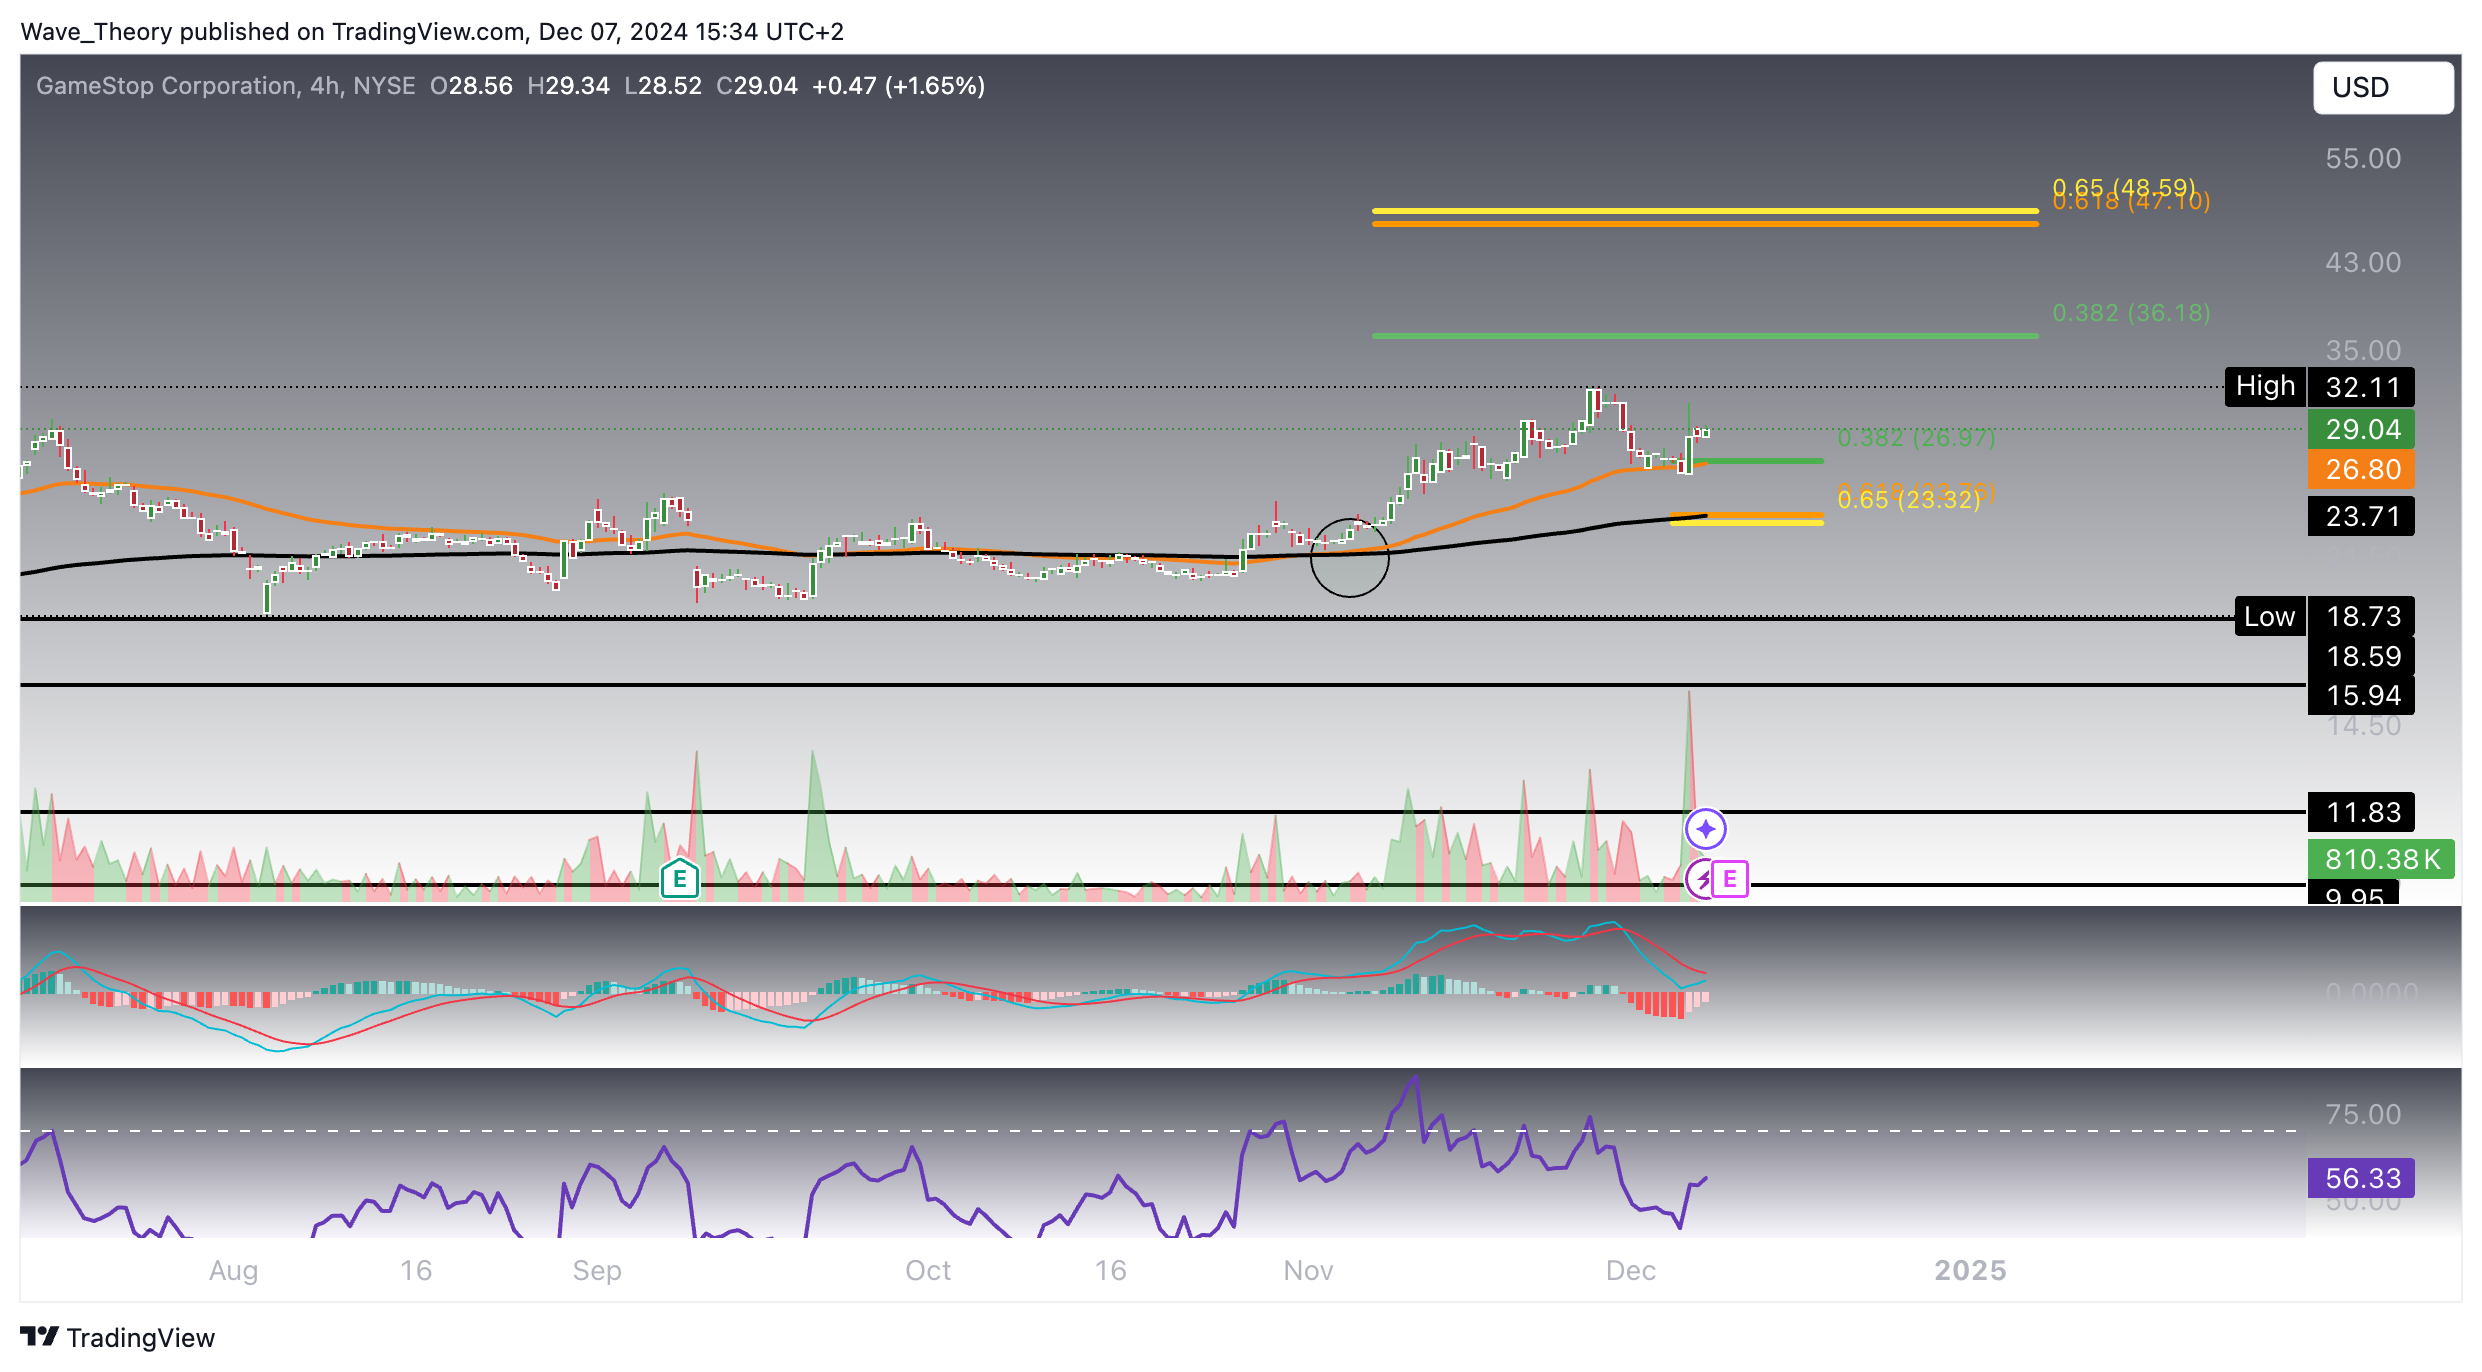
GameStop recently initiated a correction but found solid support at the 50-4H-EMA at $26.8, where it successfully bounced. Below this level, the next significant support lies at $23.7, reinforced by the 200-4H-EMA providing additional stability.
Despite the MACD lines being crossed bearishly, the histogram is ticking higher, suggesting a potential bullish recovery. The EMAs have also formed a golden crossover, confirming a bullish trend in the short term. Meanwhile, the RSI remains neutral, indicating the price could move in either direction.
Overall, the technical setup points to strong support at these levels, with a potential rebound in sight if the bullish momentum continues.
Summary
- Check out our free forex signals
- Follow the top economic events on FX Leaders economic calendar
- Trade better, discover more Forex Trading Strategies
- Open a FREE Trading Account
- Read our latest reviews on: Avatrade, Exness, HFM and XM
Related Articles

Sidebar rates
Related Posts
