Block Inc. (SQ) Stock Poised for 40% Upside? Inverse Head Shoulders Pattern Signals Potential Bullish Move
•
Last updated: Friday, December 13, 2024

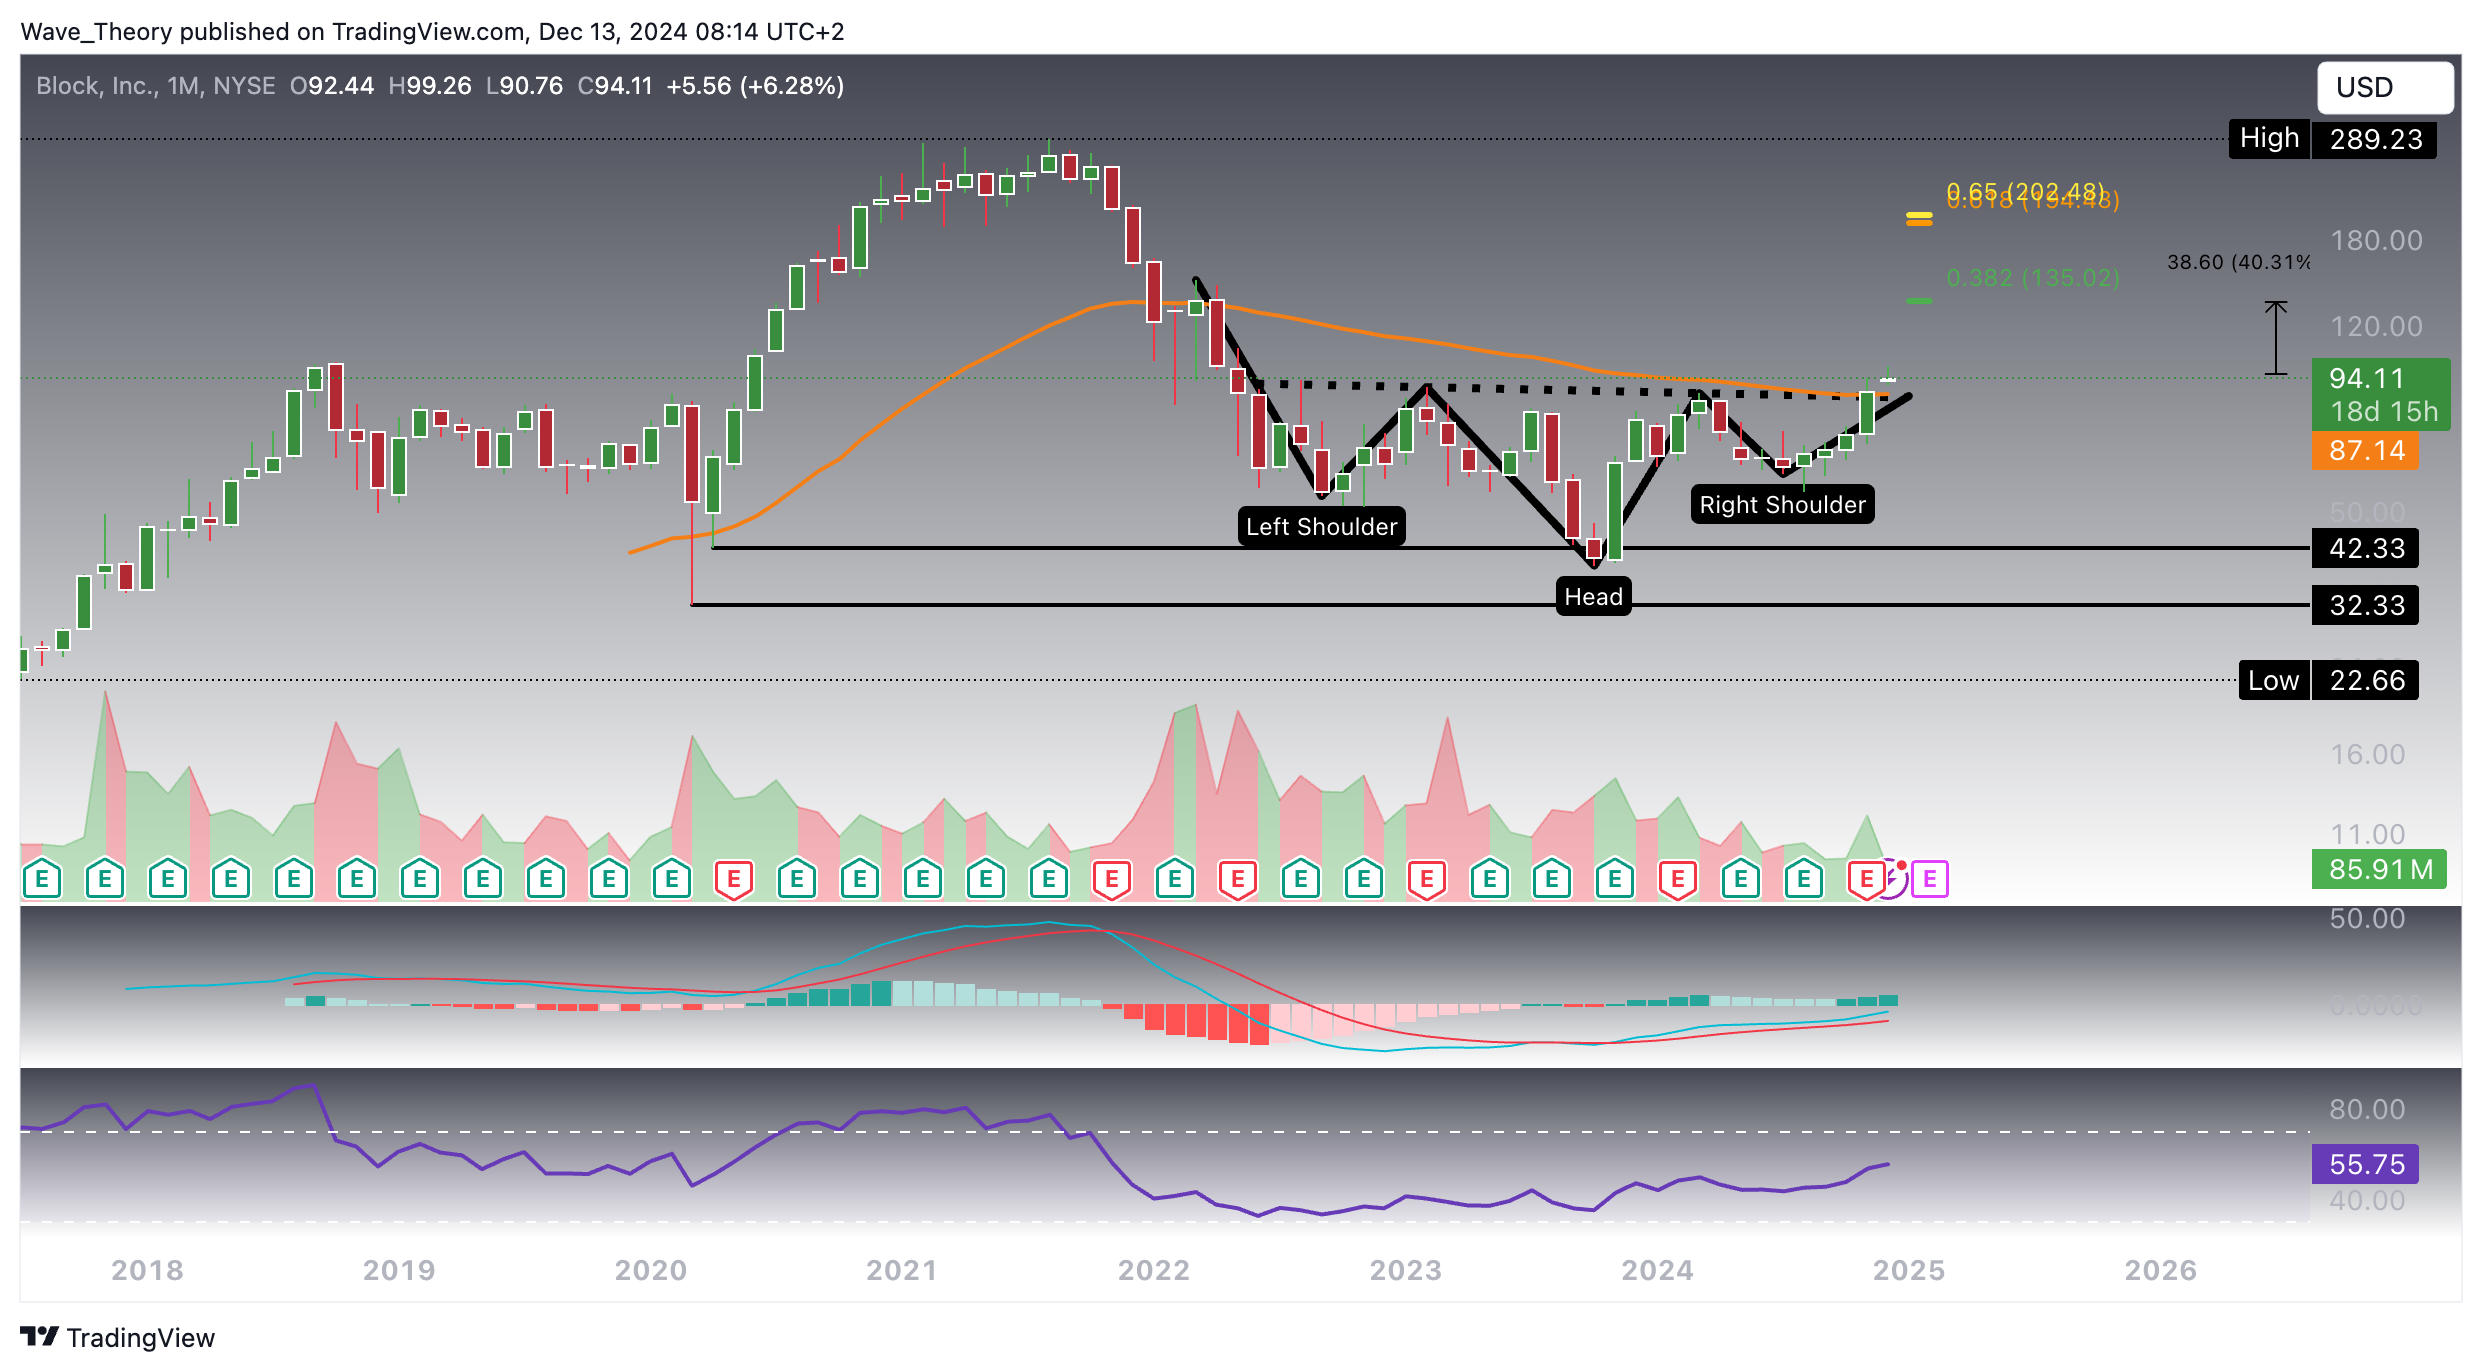
An inverse head and shoulders pattern has emerged on Block Inc. (SQ)’s monthly chart, signaling potential for a bullish reversal after a two-year downtrend. The stock bounced off key support between $32.3 and $42.3, subsequently testing the 50-month EMA at $87, where it initially faced rejection but is now breaking through. This bullish breakout could propel the stock toward the next significant Fibonacci resistance at $135, representing a 40% upside. If SQ surpasses this level, further momentum could push it toward the golden ratio at $200.
The technical indicators also support a bullish outlook:
- MACD: The MACD lines have crossed bullishly, and the histogram has been ticking higher for the past three months.
- RSI: The RSI remains neutral, neither overbought nor oversold, indicating room for upward movement.
On the downside, the 50-month EMA at $87 now serves as strong support for SQ, making it a key level to watch.
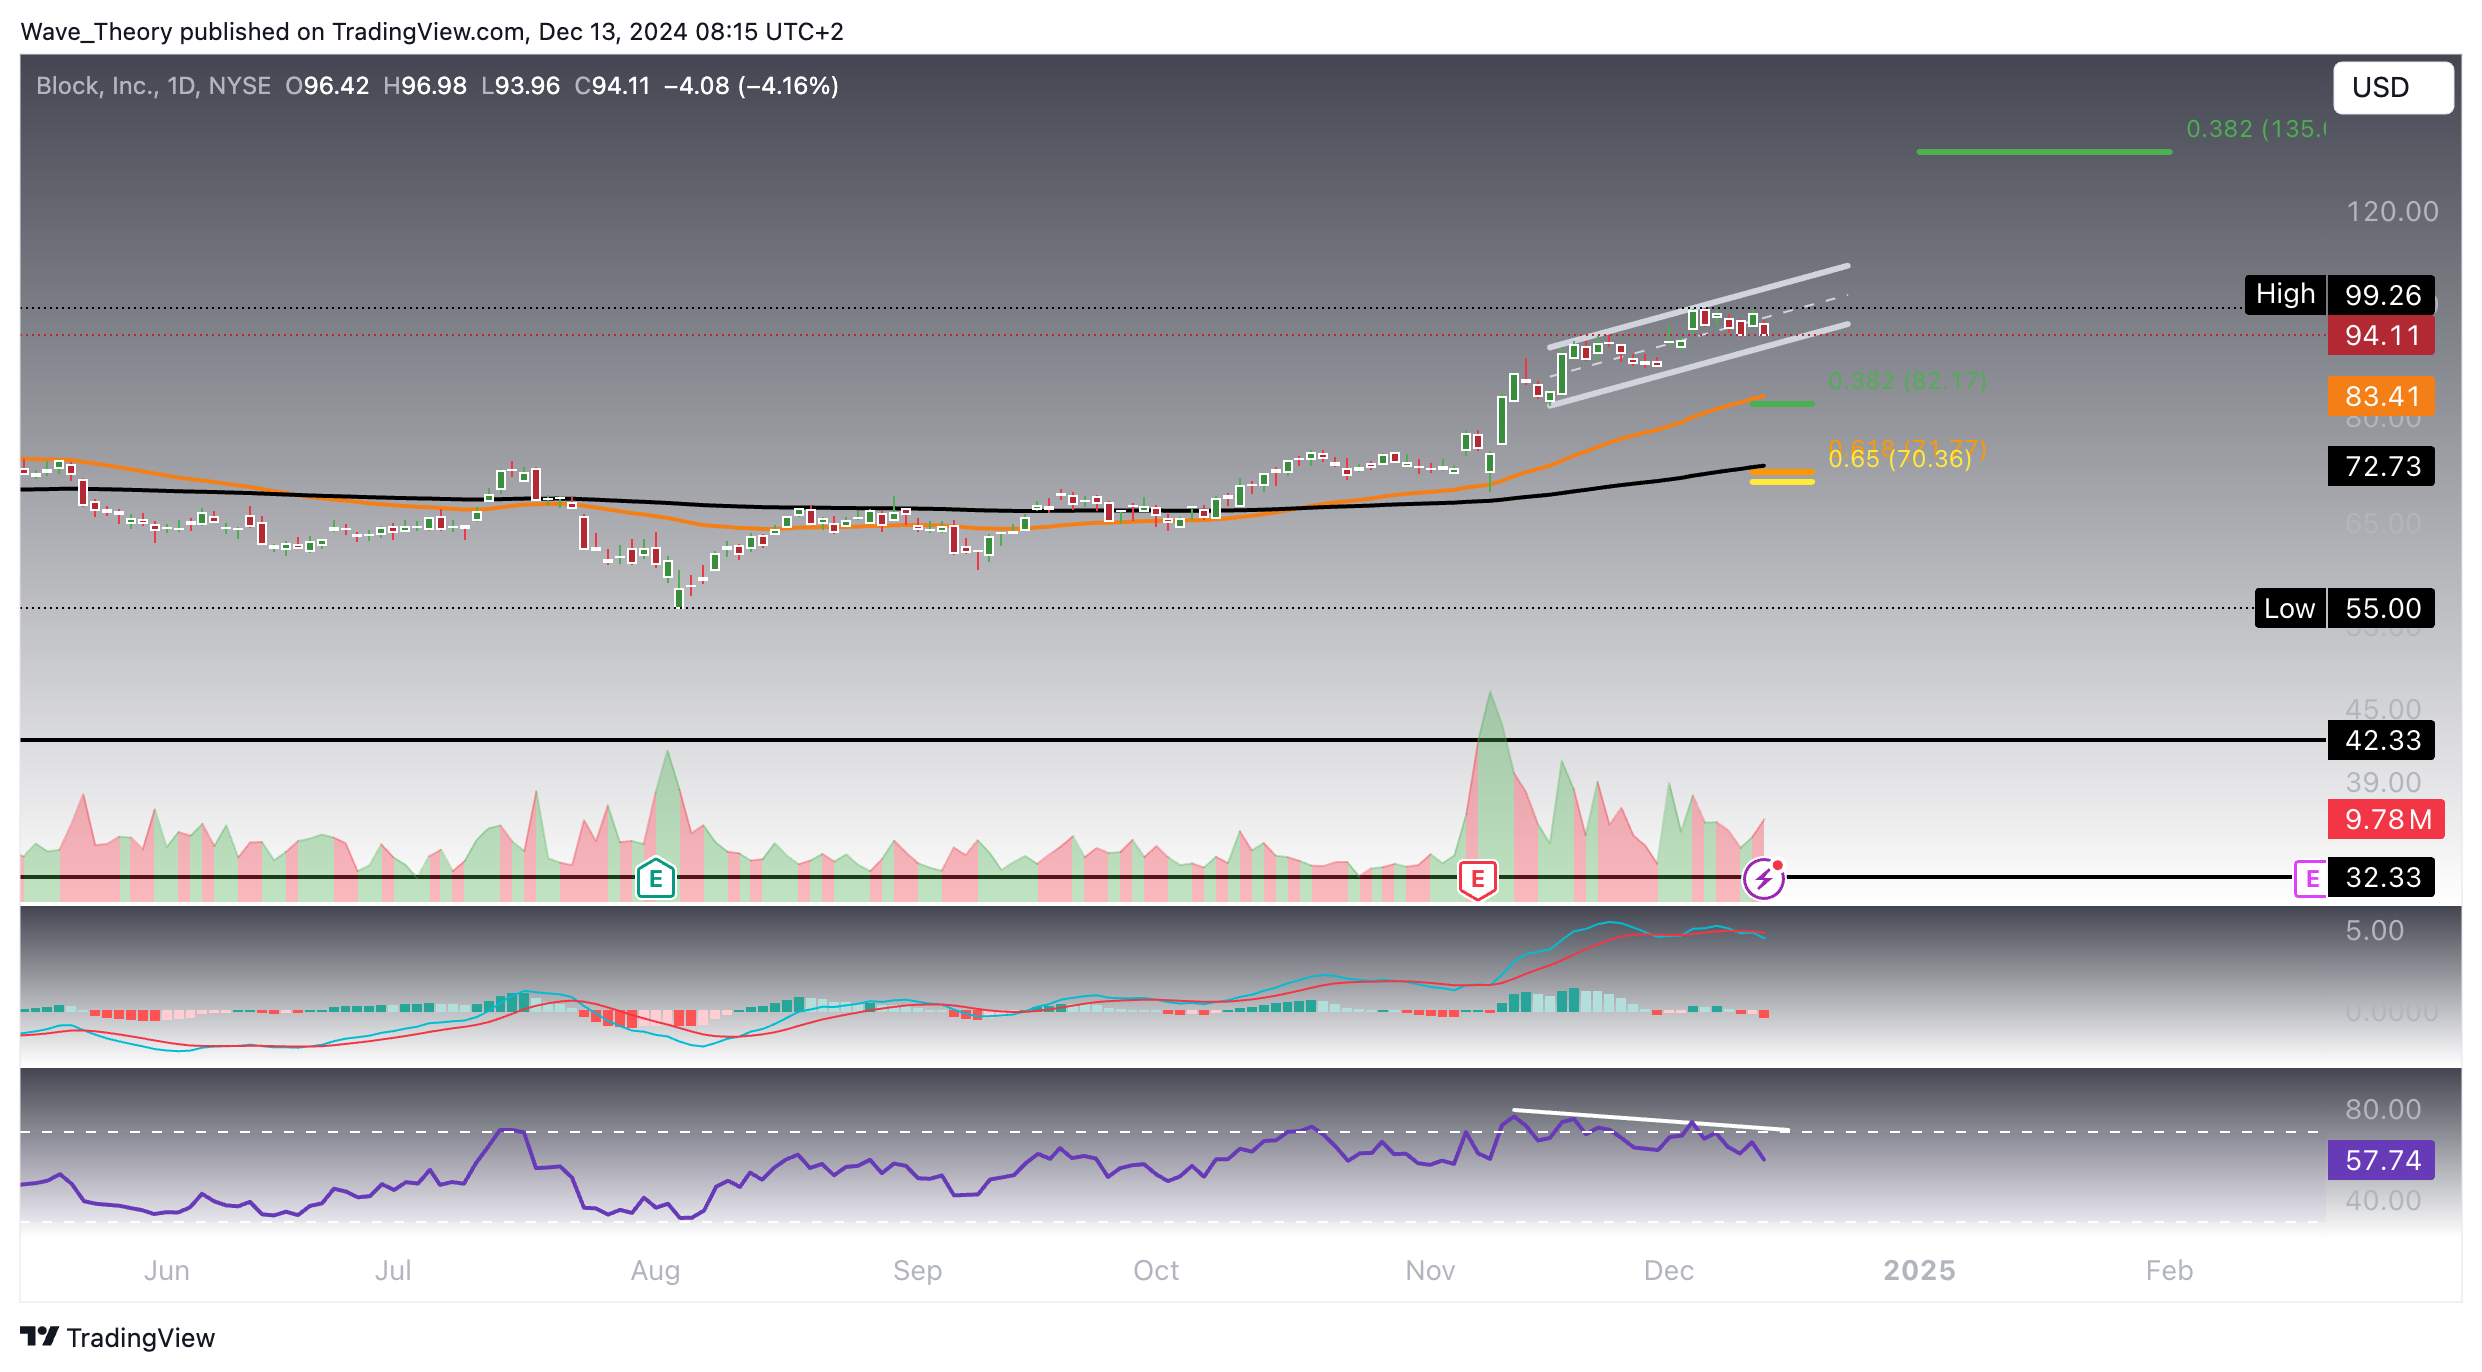
On the daily chart, SQ is trending within a well-defined parallel upward channel. However, indicators are signaling a potential shift to the downside. The MACD lines have crossed bearishly, with the histogram trending lower, and the RSI is showing a bearish divergence—both warning signs of weakening momentum.
If SQ experiences a deeper correction, it could find key Fibonacci support levels at $82 and $72. These levels are further reinforced by the 50-day and 200-day EMAs, which provide additional layers of support in the event of a sharper pullback.
The EMAs, on the other hand, have formed a golden crossover some time ago, confirming the trend bullishly in the short- to medium term.
Block
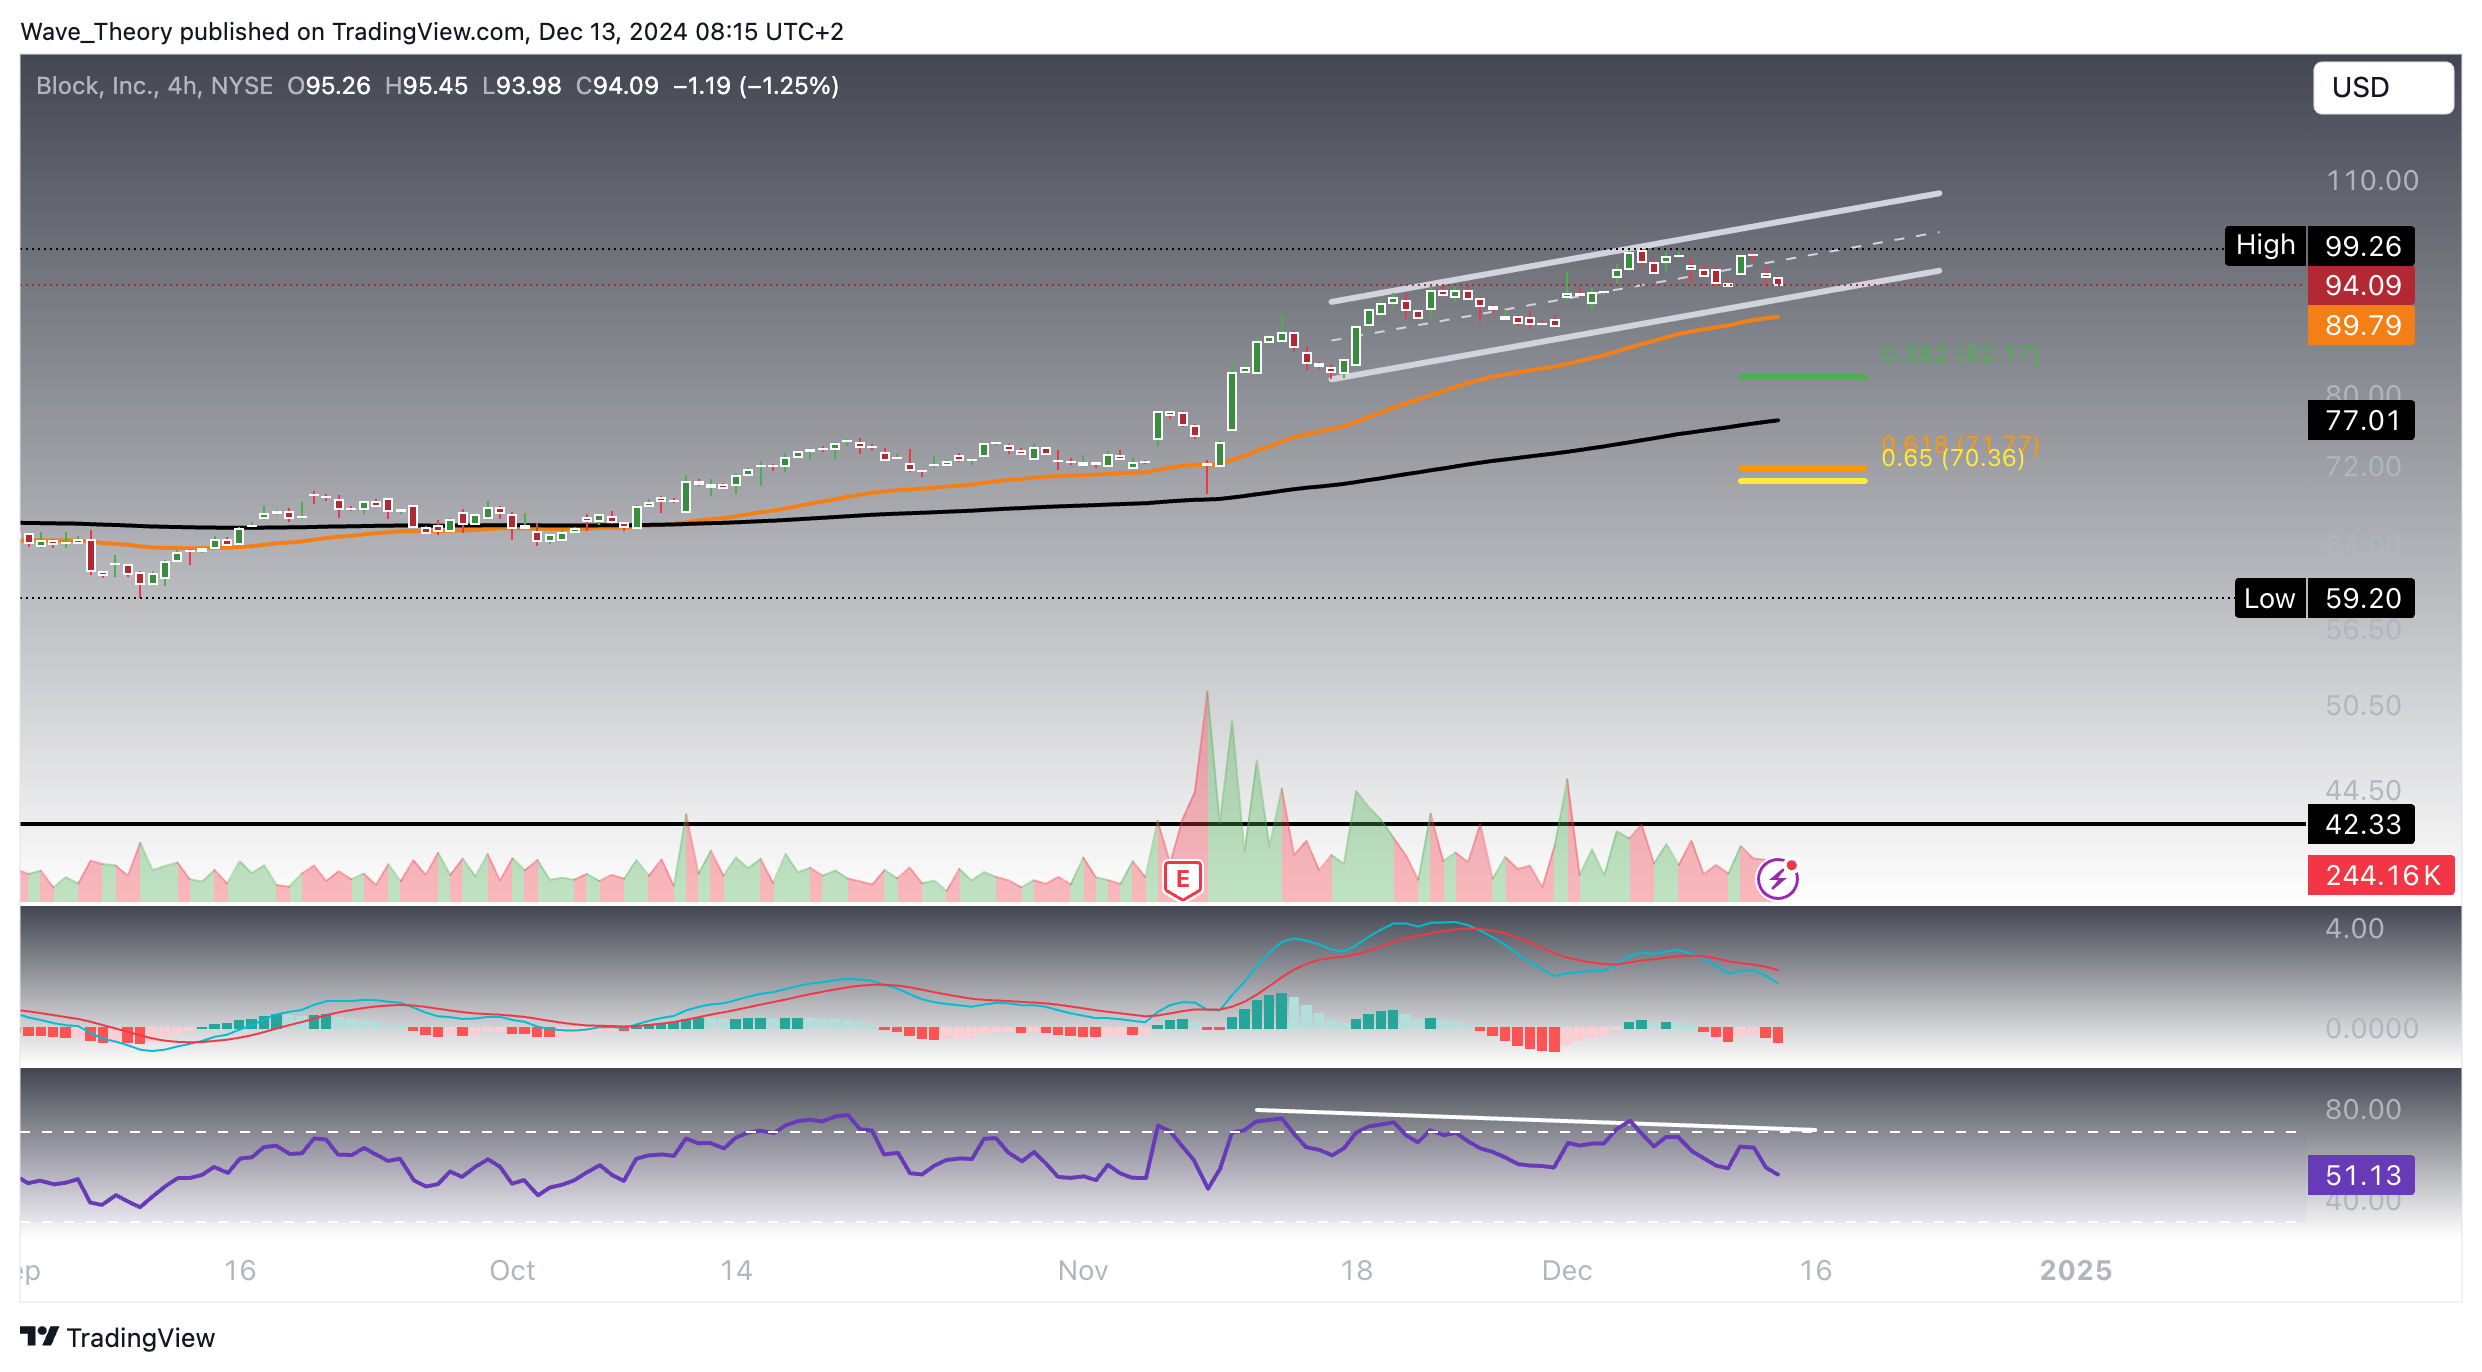
4H-Chart Shows Bearish Divergence and Bullish Trend for SQ: Similar to Daily Chart
- Check out our free forex signals
- Follow the top economic events on FX Leaders economic calendar
- Trade better, discover more Forex Trading Strategies
- Open a FREE Trading Account
- Read our latest reviews on: Avatrade, Exness, HFM and XM
ABOUT THE AUTHOR
See More
Konstantin Kaiser
Financial Writer and Market Analyst
Konstantin Kaiser comes from a data science background and has significant experience in quantitative trading. His interest in technology took a notable turn in 2013 when he discovered Bitcoin and was instantly intrigued by the potential of this disruptive technology.
Related Articles
Sidebar rates
