Nasdaq (IXIC) Bullish Trend Confirmed Despite Short-Term Correction Risks

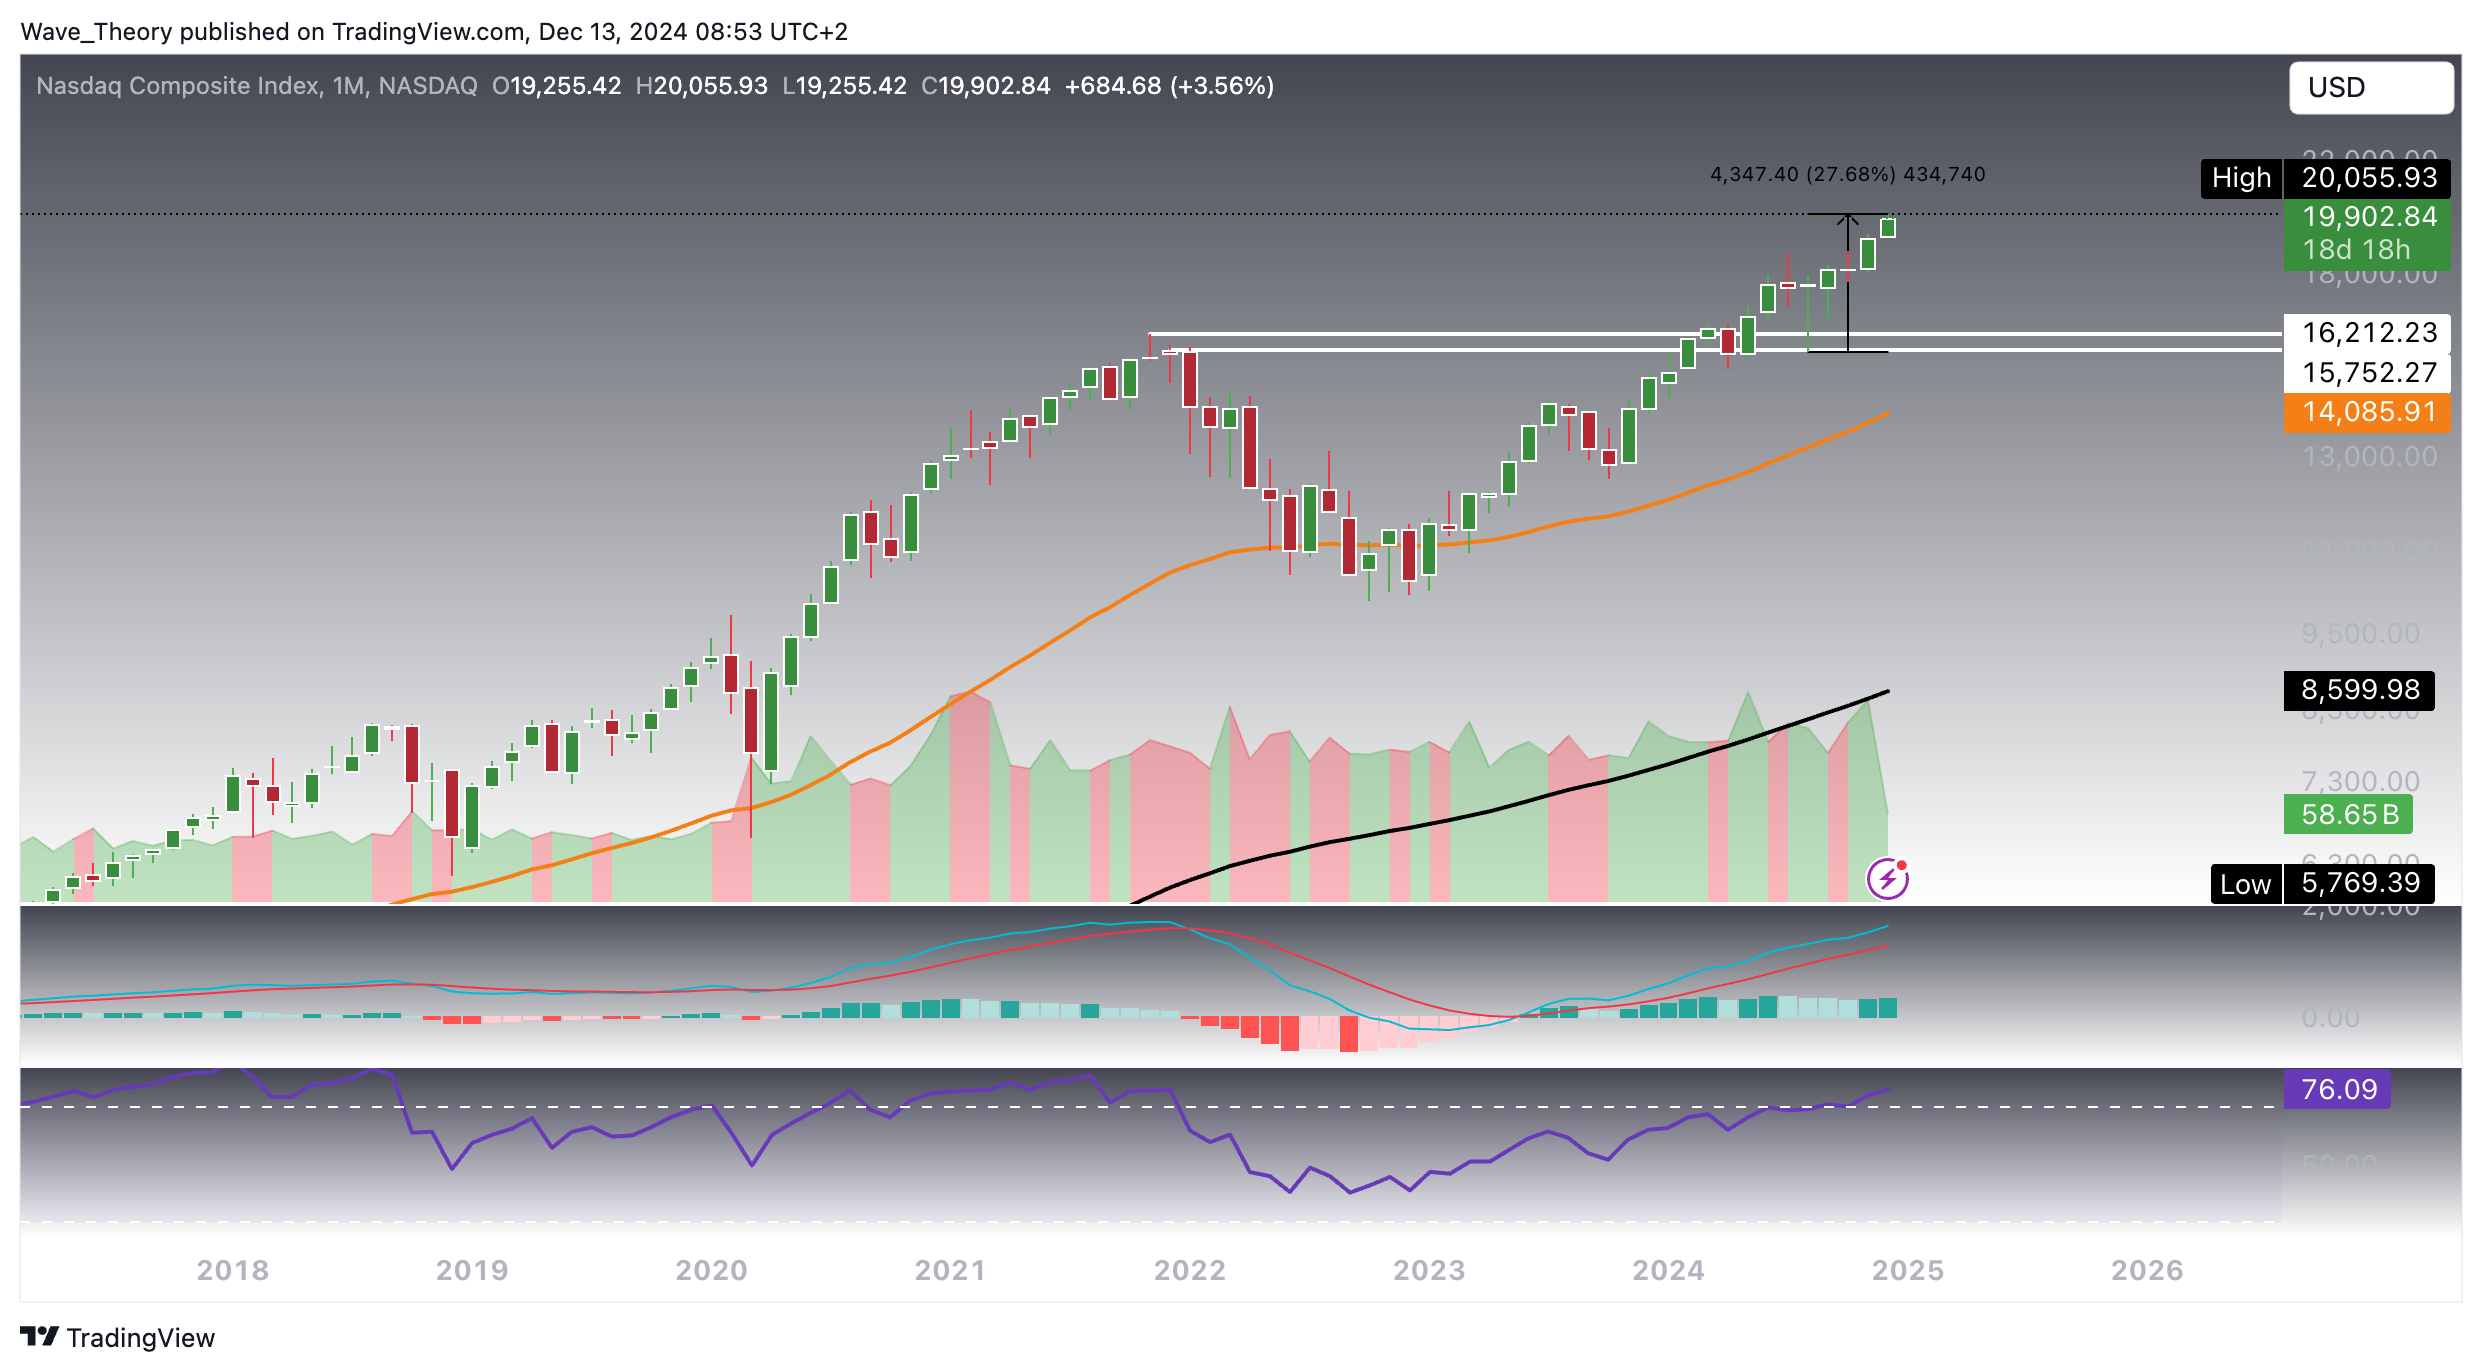
Since bouncing off the support zone between 15,752 and 16,212, Nasdaq has surged approximately 28%, with no immediate resistance in sight.
Technical Indicators and Trends (Monthly Chart):
- MACD: The MACD lines are crossed bullishly, and the histogram has been trending higher for the past month, reinforcing the upward momentum.
- RSI: The RSI remains in overbought territory, but notably, there is no bearish divergence, indicating continued strength in the rally.
- EMA: The EMAs remain bullishly aligned, confirming a long-term uptrend and further supporting the bullish outlook.
With these indicators aligning, Nasdaq could continue its upward trajectory in the near term.
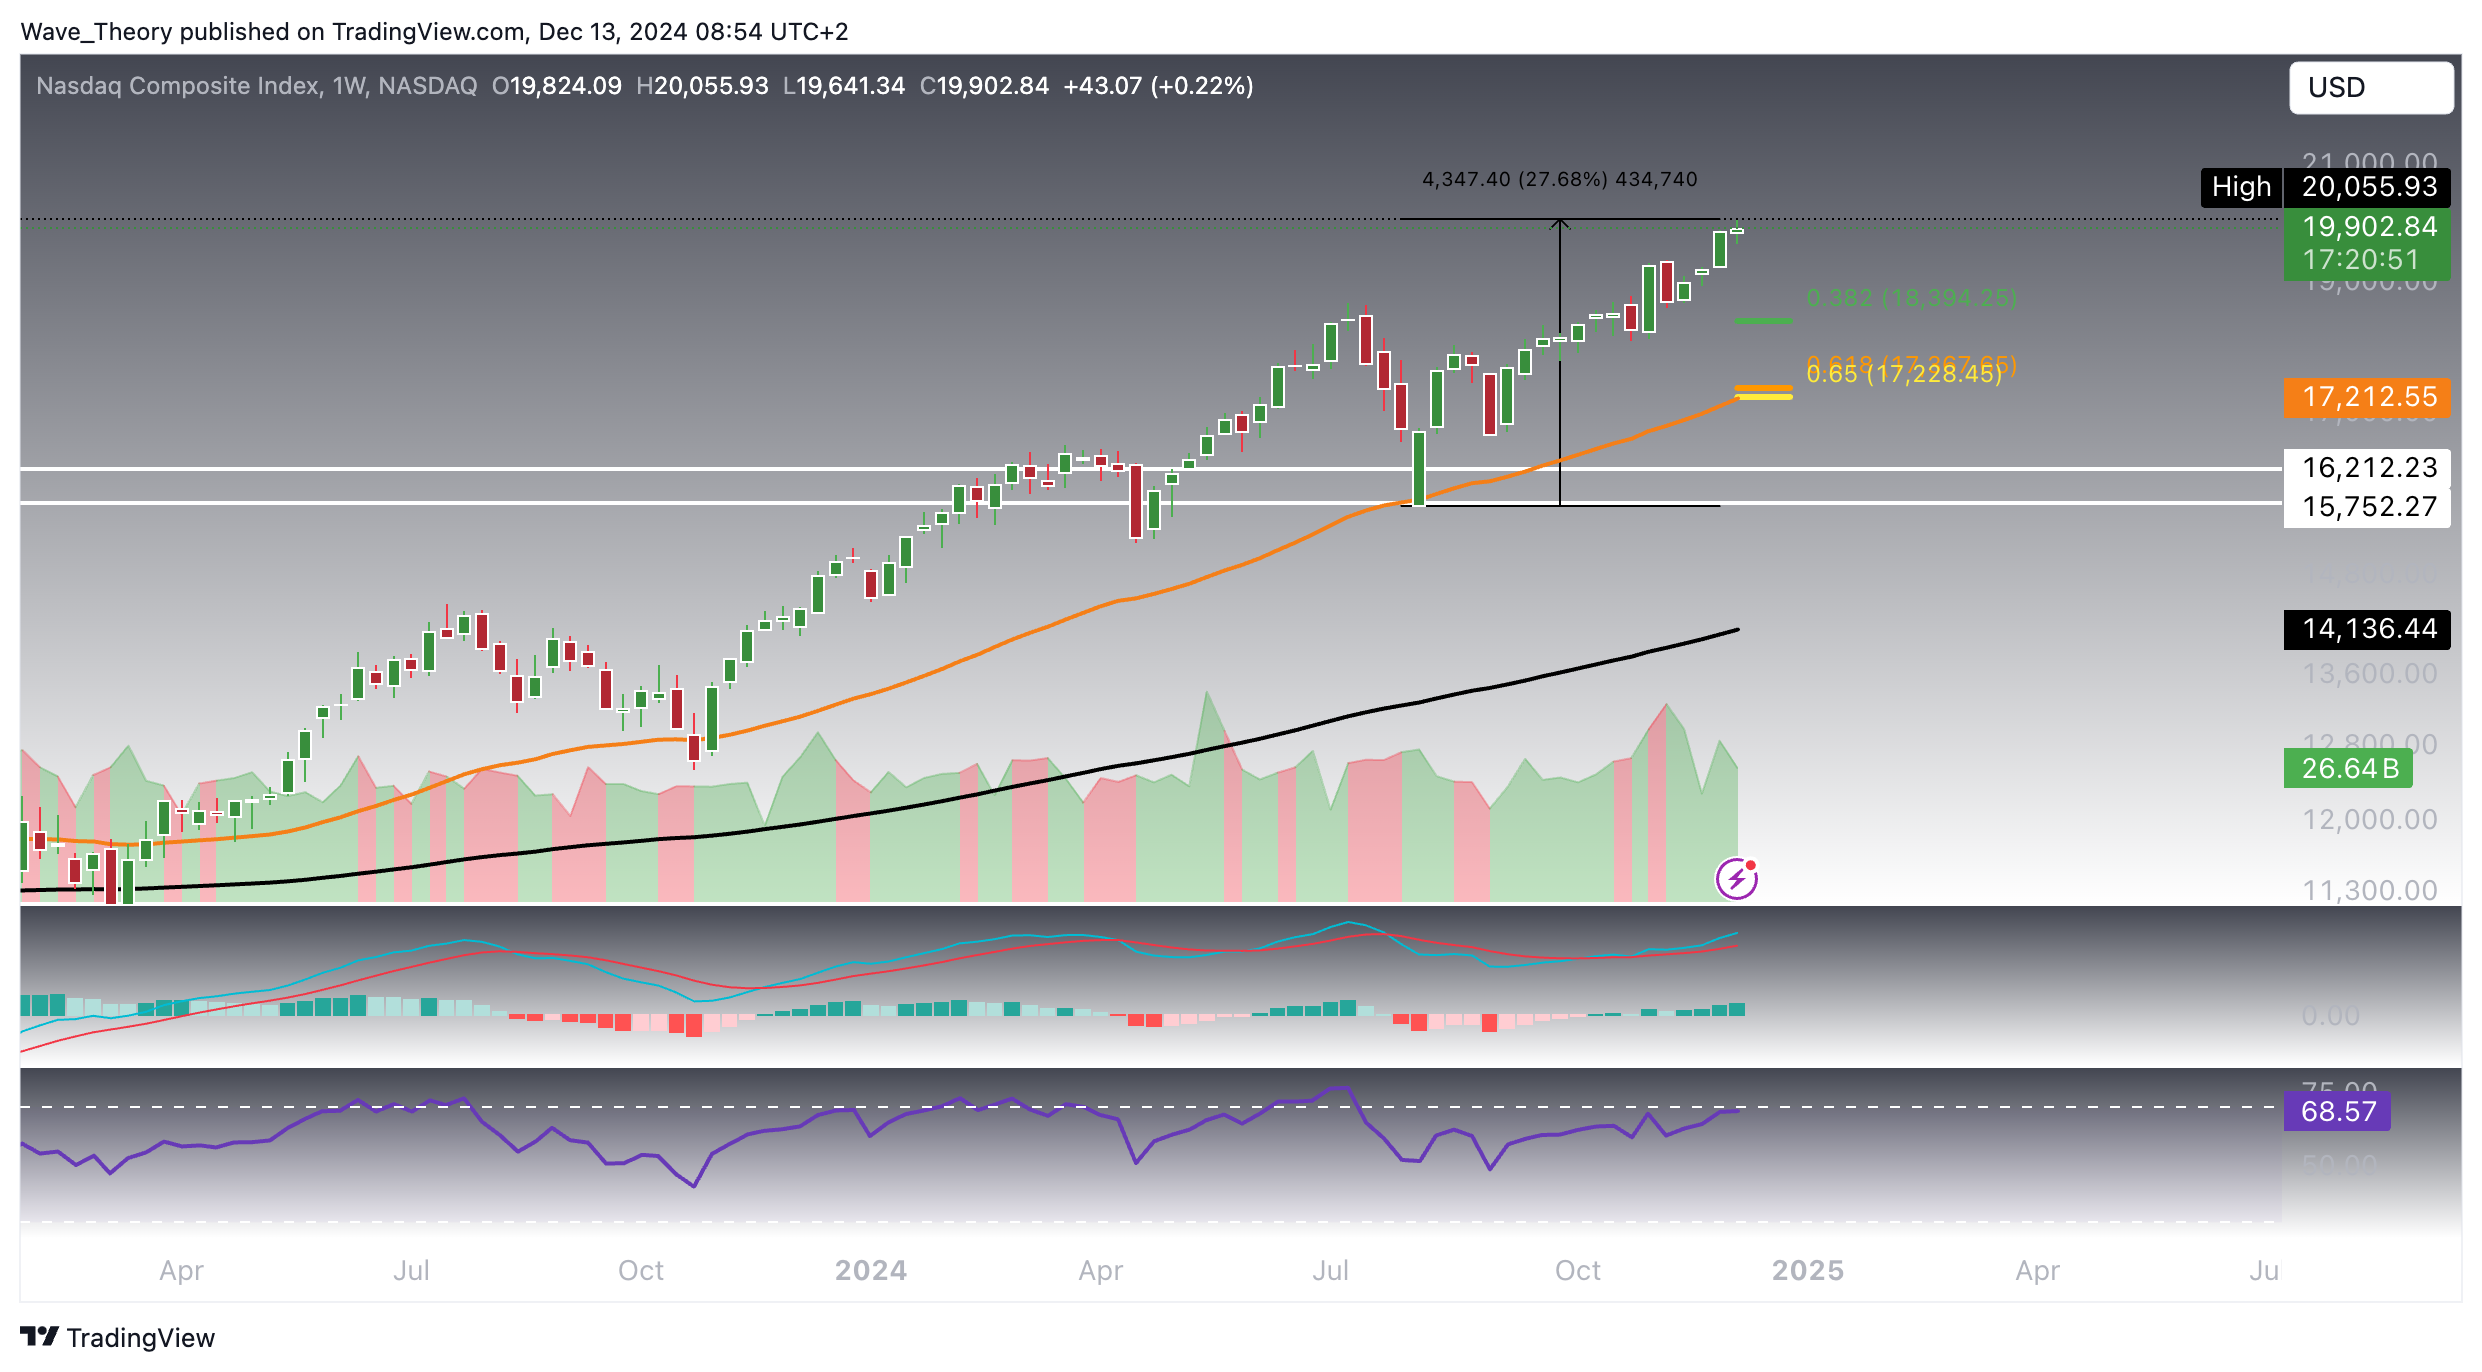
Nasdaq Composite Index (IXIC): Key Support Levels To Watch
Should the Nasdaq Composite Index (IXIC) undergo a correction, key Fibonacci support levels can be found at 18,394 and 17,200. The 50-week EMA also reinforces the 17,200 level, offering additional support. Despite potential short-term pullbacks, the overall outlook remains bullish.
- MACD: The MACD lines are crossed bullishly, and the histogram has been ticking higher for the past four weeks, signaling continued strength.
- RSI: While bordering overbought levels, the RSI shows no bearish divergence, indicating the absence of immediate downside risk.
- EMAs: The EMAs continue to align bullishly, confirming the trend remains upward in the mid-term.
In summary, while a correction may test key support levels, the broader trend suggests further upside potential in the weeks ahead.
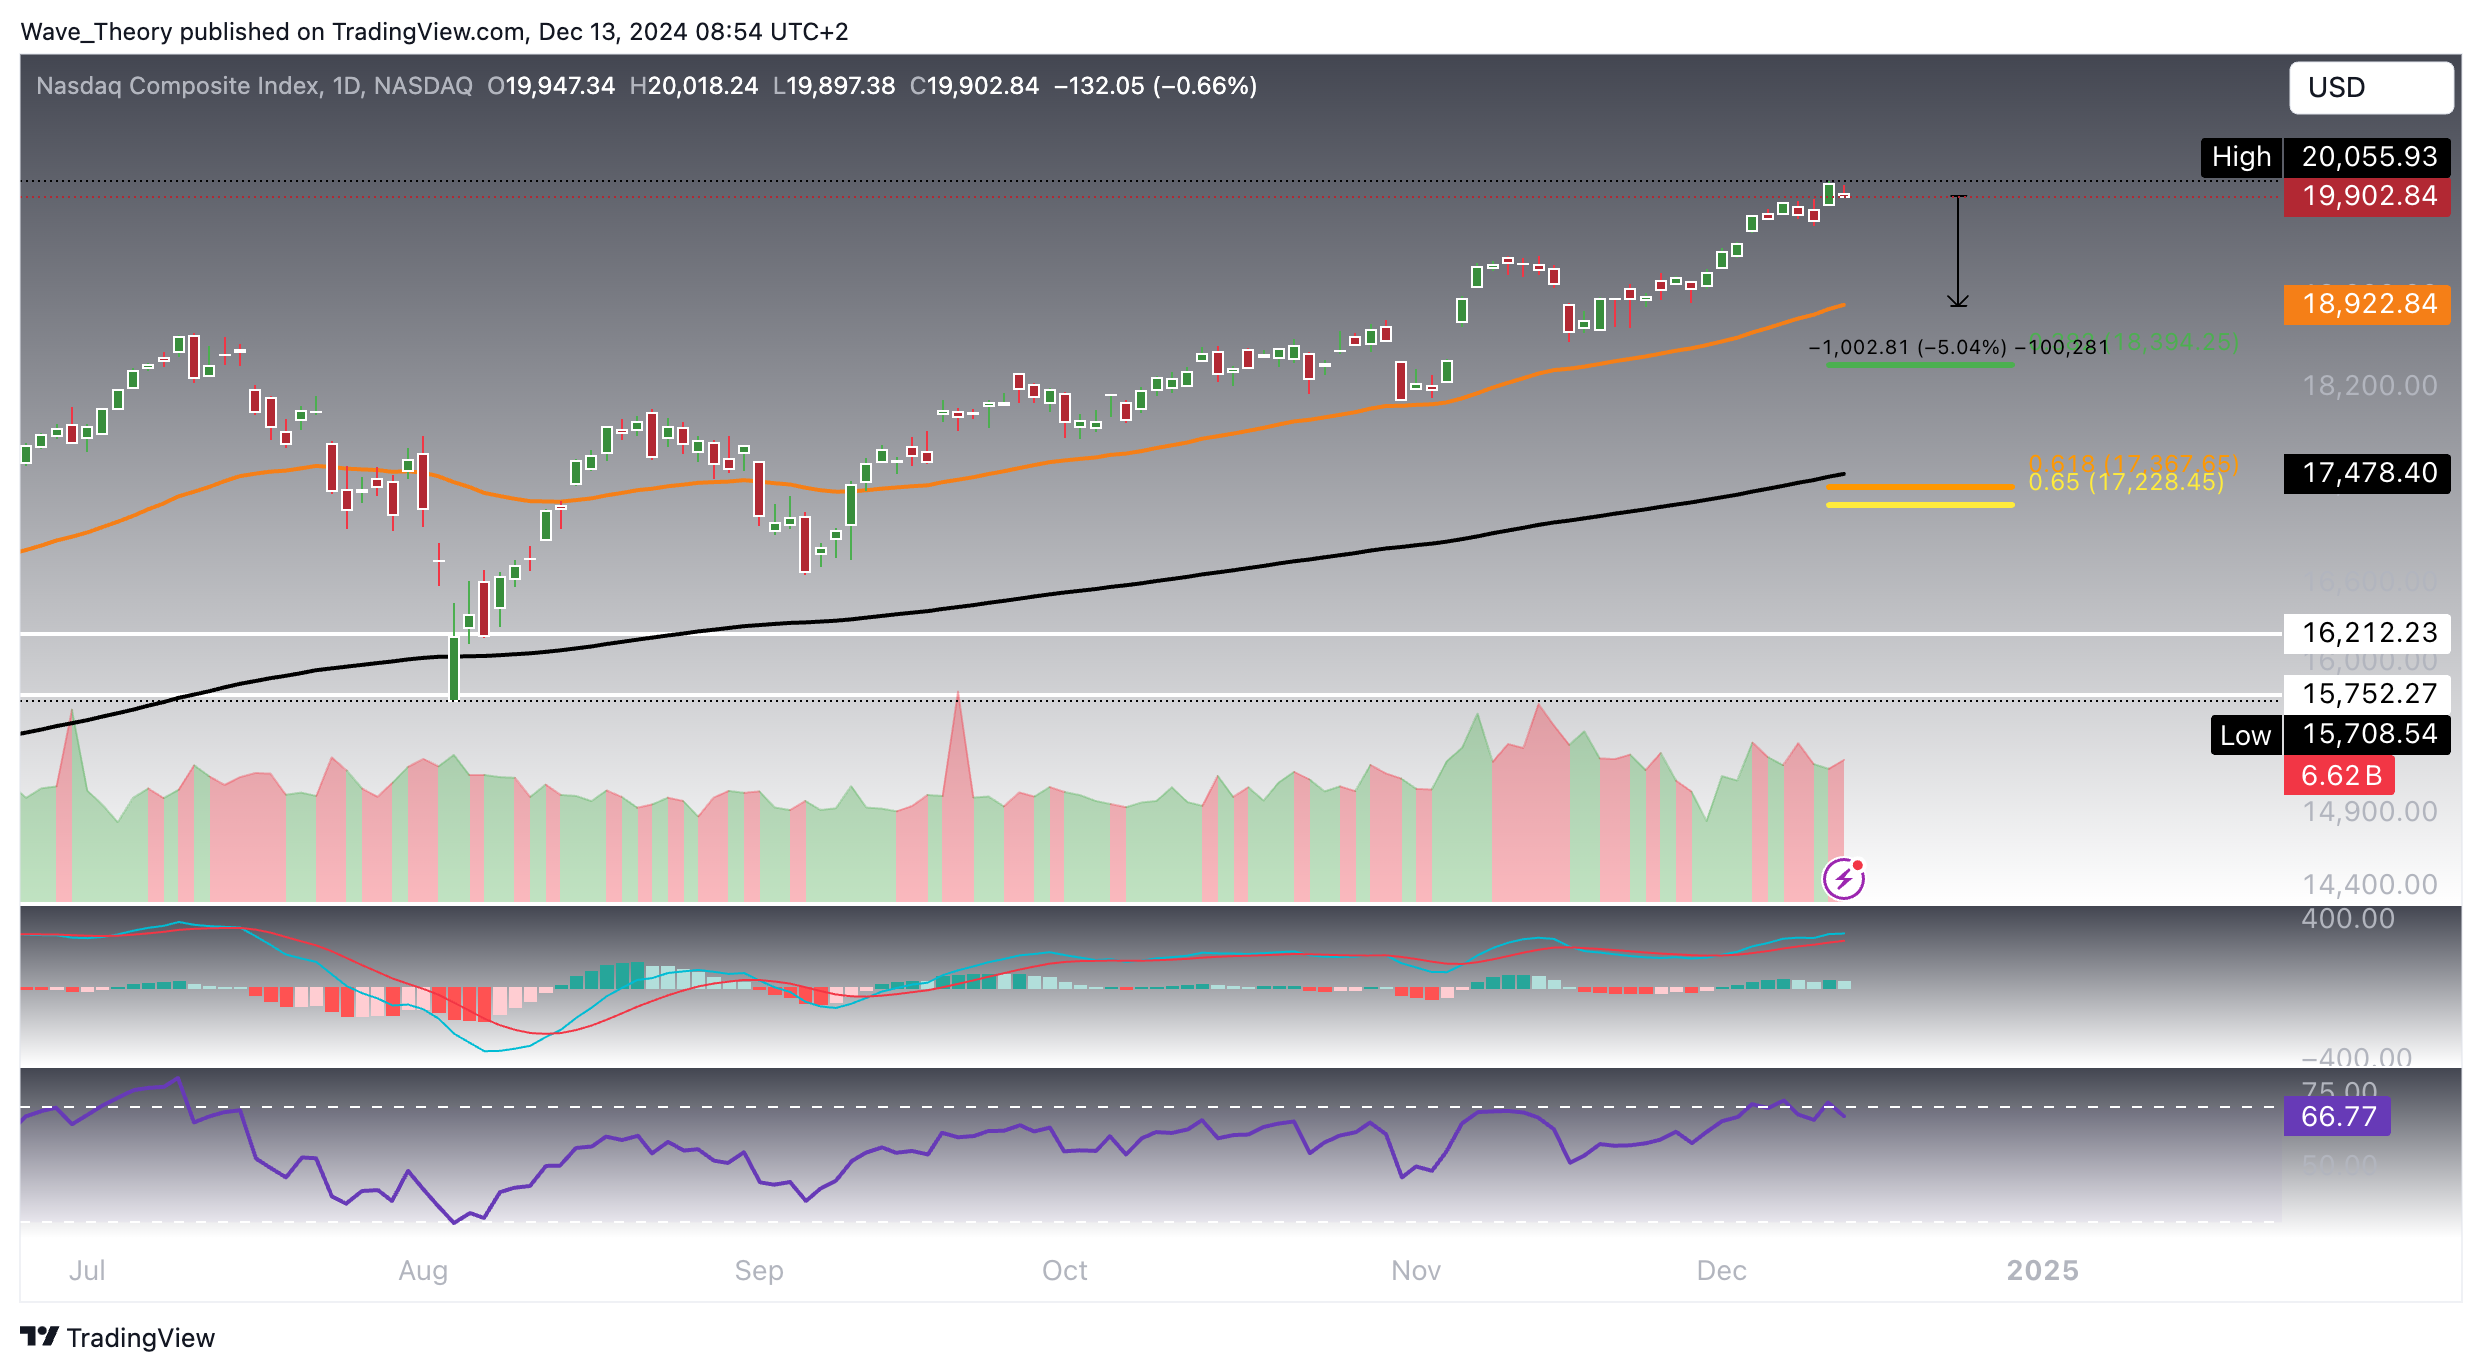
Will Nasdaq Correct To The 50-Day-EMA?
The Nasdaq Composite (IXIC) may retrace to the 50-day EMA at 18,923, a level it recently tested before bouncing bullishly to continue its upward momentum. The daily indicators are offering mixed signals.
- MACD and EMAs: Both are crossed bullishly, reaffirming the overall uptrend.
- RSI: The RSI is nearing overbought territory, suggesting limited room for further gains in the short term.
- MACD Histogram: Ticking lower today, signaling possible near-term weakness.
If the IXIC corrects to the 50-day EMA, this would imply a potential downside of approximately 5%. However, the broader bullish trend remains intact.
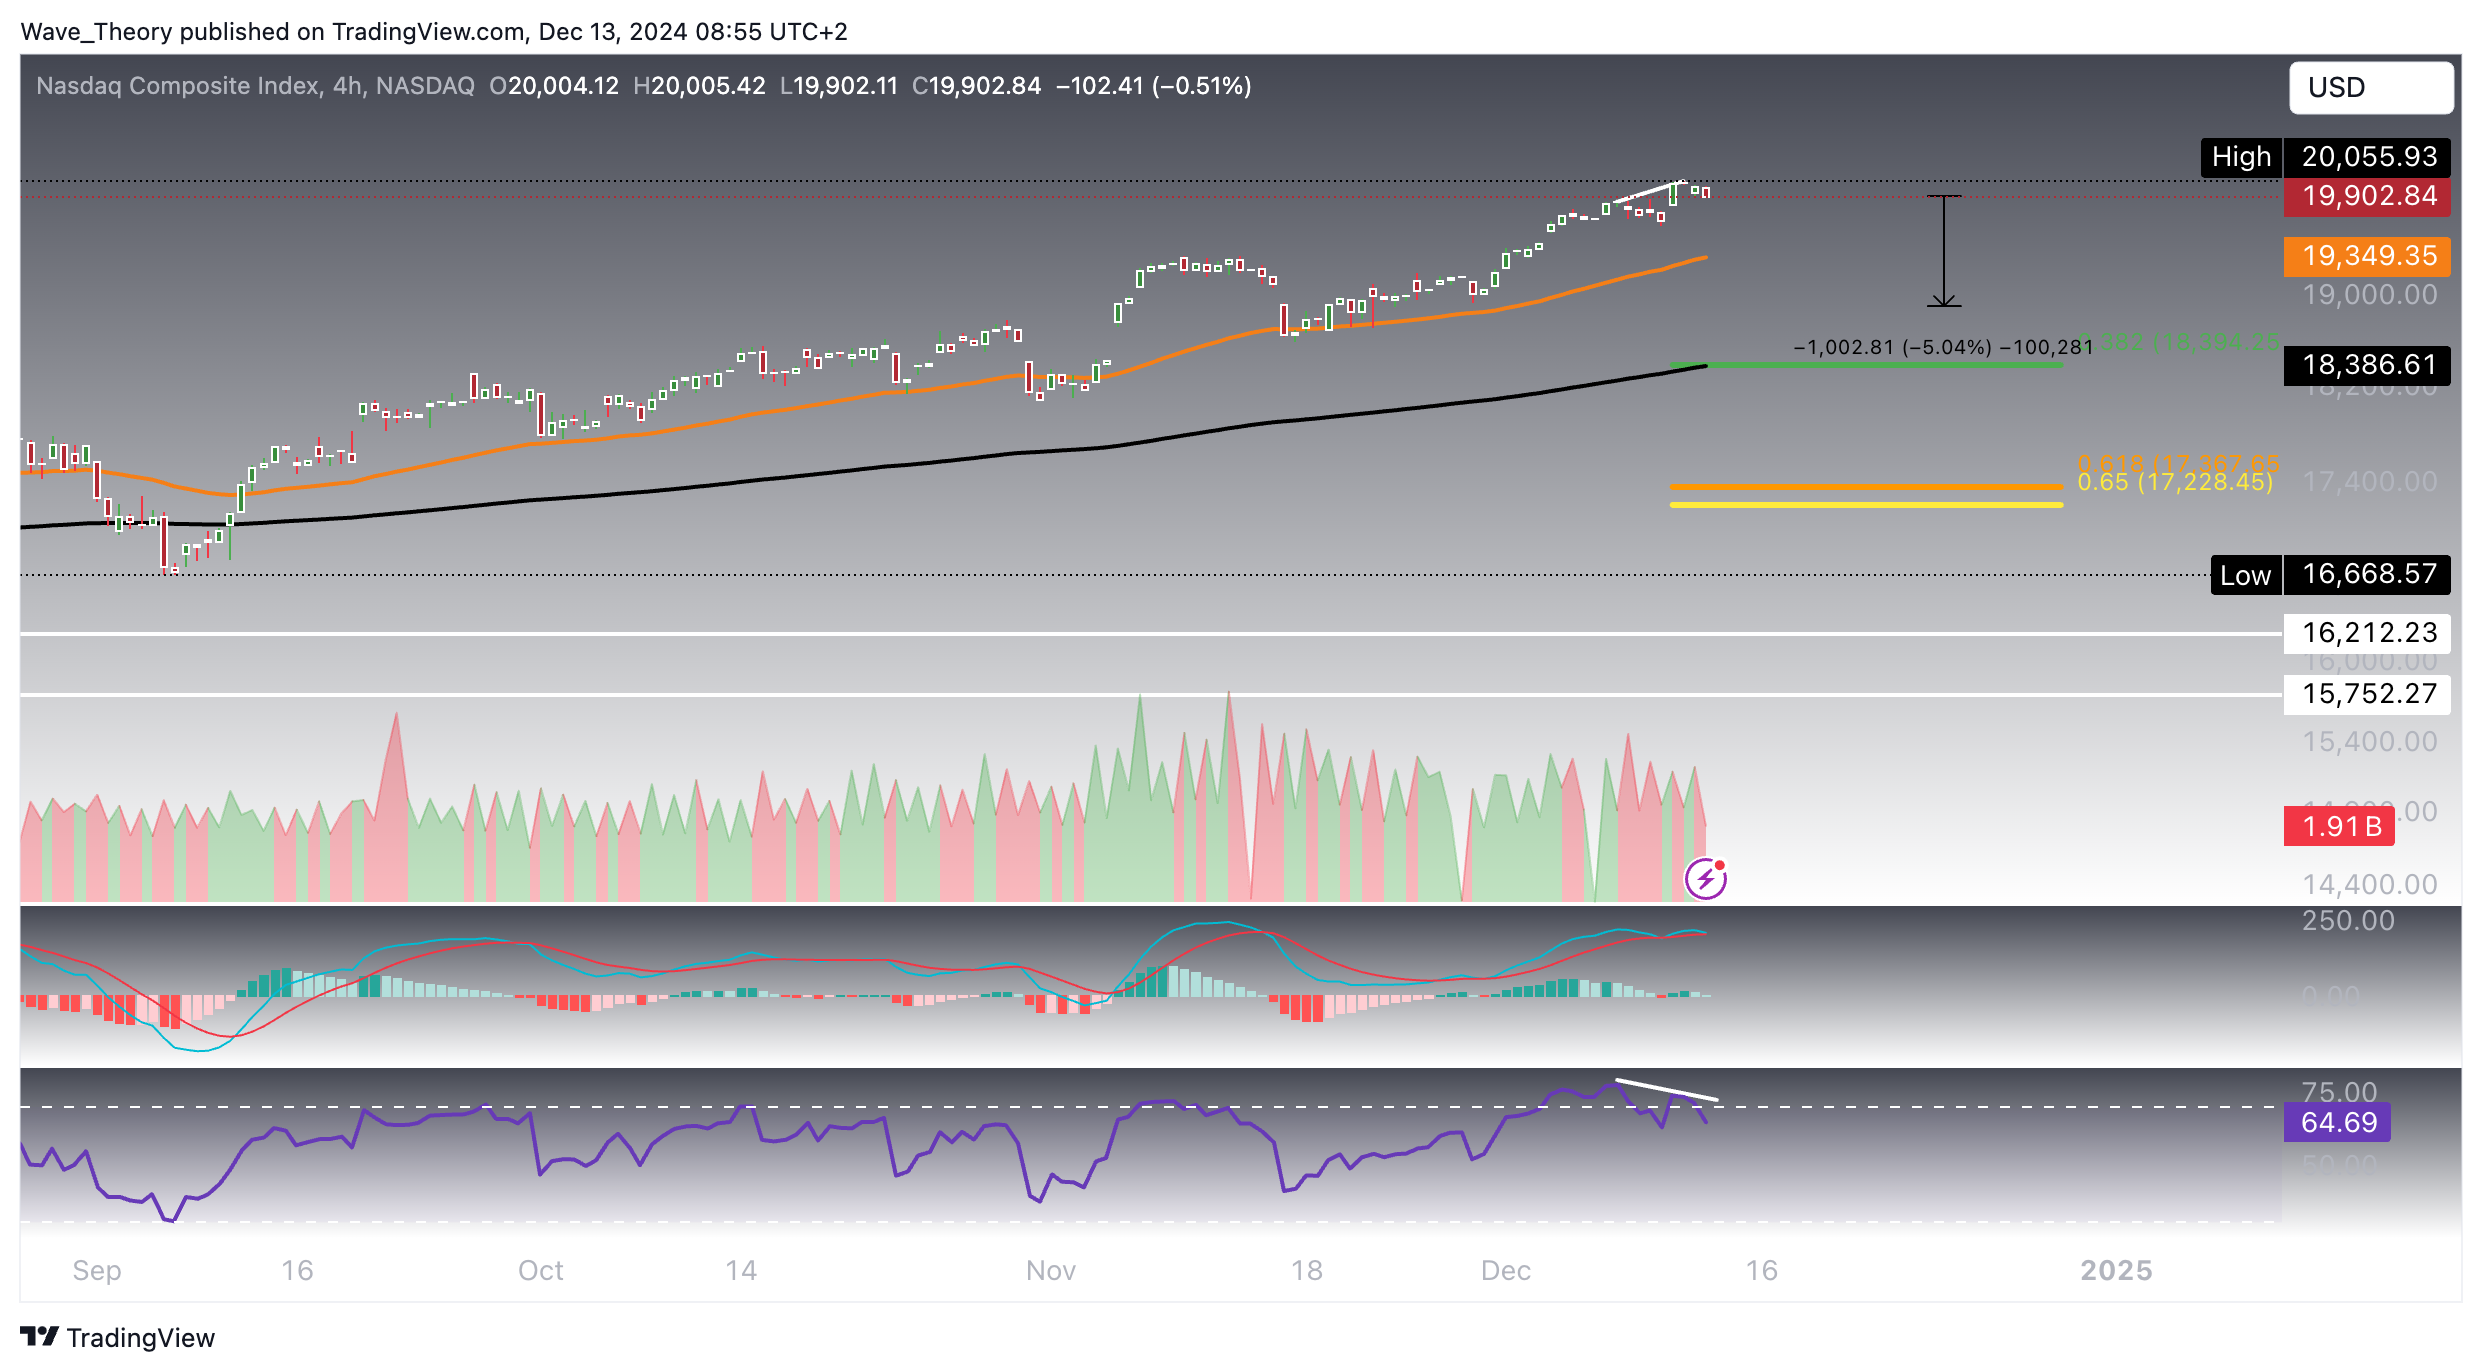
Bearish Divergence Emerging On The 4-Hour Chart
On the 4-hour chart, the EMAs have formed a golden crossover, confirming the bullish trend in the short term. The MACD lines are also crossed bullishly, reinforcing this momentum. However, some caution is warranted as the MACD histogram is ticking bearishly lower, and the RSI is showing a bearish divergence, suggesting a potential short-term pullback.
While IXIC may experience a correction in the near term, the mid-term outlook remains strongly bullish, with the overall trend still favoring further upside.
- Check out our free forex signals
- Follow the top economic events on FX Leaders economic calendar
- Trade better, discover more Forex Trading Strategies
- Open a FREE Trading Account
- Read our latest reviews on: Avatrade, Exness, HFM and XM
Related Articles


Sidebar rates
Related Posts
