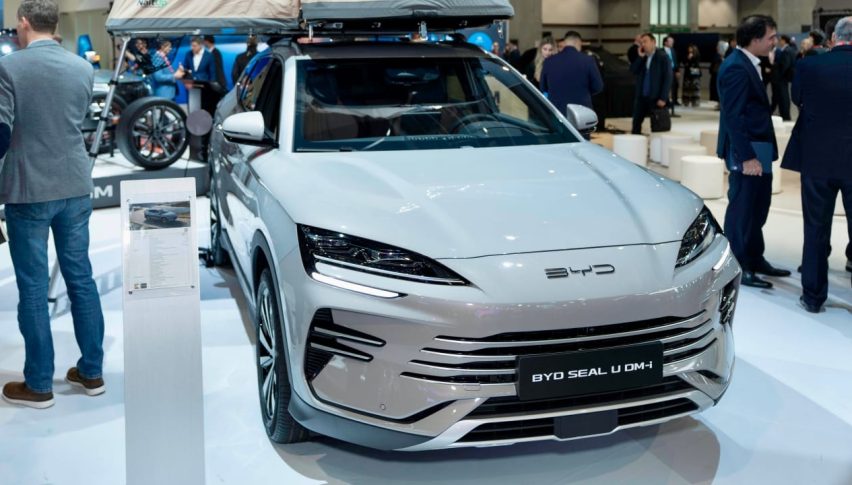
Chinese EV Giant BYD Poses Strong Competition to Tesla, Achieves 10x Growth in 5 Years
BYD, a leading Chinese automaker, has emerged as a formidable competitor to Tesla in the electric vehicle (EV) space. With its advancements in autonomous driving technology and innovative battery solutions, BYD continues to solidify its position as a major player in the global EV market.
BYD Company Limited Reaches A New ATH At HK$372.4
BYD stock has experienced an impressive rally, surging over 1,011% since March 2020. This month alone, it has gained 40%, breaking through key resistance between HK$324.6 and HK$333 to reach a new all-time high (ATH) of HK$372.4. With this bullish breakout, further upside potential emerges as there are no significant resistances ahead. The MACD histogram continues to tick bullishly higher, and the MACD lines, along with the EMAs, remain bullishly crossed, confirming the long-term bullish trend. While the RSI is approaching overbought levels, there are no bearish signals yet, keeping the outlook optimistic.
BYD Stock: Key Support Levels To Watch
If BYD stock undergoes a correction, it finds immediate horizontal support between HK$324.6 and HK$333. Should this level fail to hold, the next significant Fibonacci support levels are at HK$251 and HK$144. Despite this, the indicators present a bullish outlook on the weekly chart. Both the MACD lines and EMAs remain bullishly crossed, and the histogram continues to exhibit a bullish trend, reinforcing the mid-term bullish stance. While the RSI is approaching overbought regions, signaling caution, it has already invalidated the possibility of a bearish divergence on the weekly chart.
Warning Signs On The Daily Chart
On the daily chart, however, the RSI is forming a bearish divergence, with the MACD histogram trending bearishly. Despite this, both the EMAs and MACD lines remain bullishly crossed, confirming the trend as bullish in the short to medium term. If BYD enters a corrective phase, the next support zone suggests a potential downward move of approximately 12%.
More Warning Signs On The 4H Chart
The 4H chart mirrors this outlook, with the RSI showing a bearish divergence and the MACD histogram ticking predominantly lower. However, both the MACD lines and EMAs remain bullishly crossed, maintaining the bullish trend even in the short term. Despite this, the emerging warning signs suggest exercising caution moving forward.
Sidebar rates
Add 3442
Related Posts
XM
Best Forex Brokers
