Crude Oil Prices Struggle: WTI Rebound Fails at Resistance, Resumes Decline After EIA
Crude oil prices are once again falling as trade dynamics, policy changes, and technical resistance zones weigh on the energy sector.

Quick overview
- Crude oil prices are declining due to trade dynamics, policy uncertainty, and technical resistance.
- Despite a brief recovery, both WTI and Brent crude face significant selling pressure near key moving averages.
- Recent EIA data shows a larger-than-expected draw in crude inventories, but rising gasoline and distillate stockpiles raise concerns about demand.
- Traders remain cautious, anticipating potential volatility in oil prices influenced by macroeconomic factors and refining output.
Live USOIL Chart

Crude oil prices are once again falling as trade dynamics, policy changes, and technical resistance zones weigh on the energy sector.
Oil Recovery Loses Momentum as Resistance Holds
Crude oil prices continued their downward drift today, weighed down by shifting global trade dynamics, ongoing policy uncertainty, and key technical resistance zones that have repeatedly stalled attempted rallies. The weakness follows a fragile recovery effort that began in early May, only to run into stiff selling pressure near major moving averages and psychological price levels.
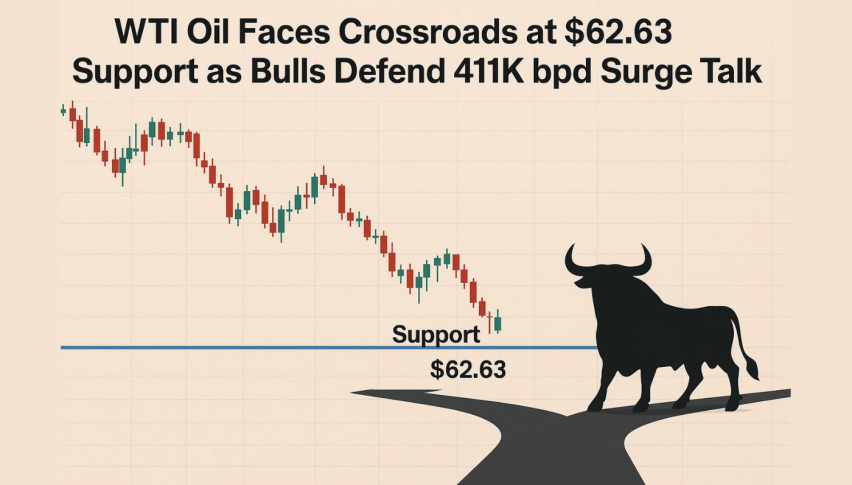
After establishing a bottom in early April, West Texas Intermediate (WTI) crude made a modest recovery, bouncing twice off strong support near $55 per barrel. Brent crude showed a similar pattern, rebounding from lows around $58.50. Both benchmarks were hit hard earlier in the quarter by rising global tariffs and deteriorating trade conditions, which dragged the entire commodity complex lower.
WTI Crude Oil Chart Daily – 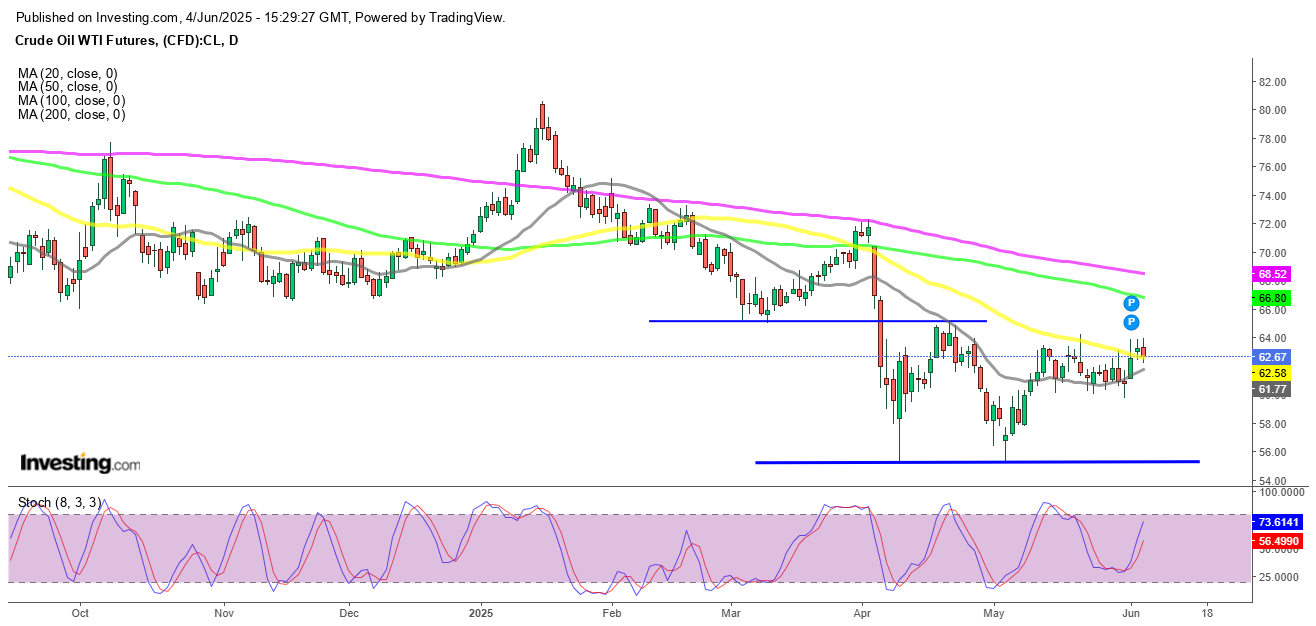
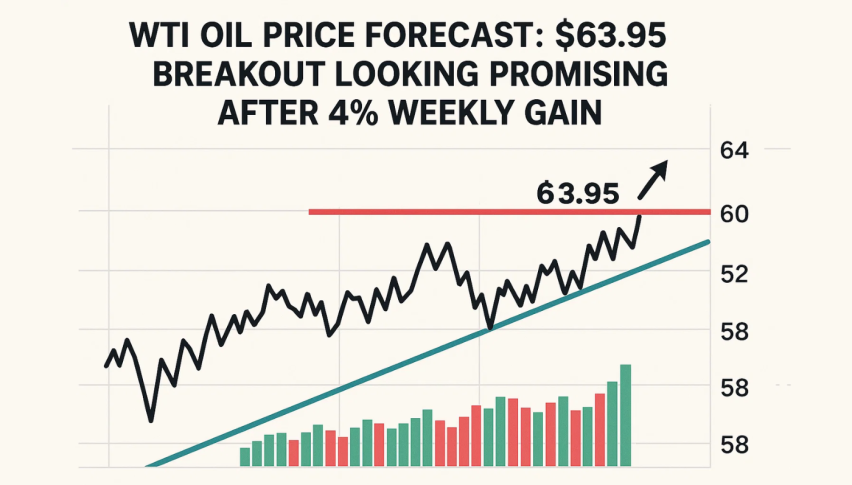
For a brief period, hopes of progress in U.S.–China trade negotiations helped calm market nerves. This helped lift Brent to above $66 and nudged WTI closer to the $63–$64 range. However, technical hurdles soon re-emerged. WTI encountered heavy resistance at its 50-day simple moving average, a key chart indicator that temporarily capped its upside. Although WTI did manage to briefly break above that level on Monday, the move was short-lived, with the price quickly retreating under $64 following the latest EIA inventory data.
U.S. Weekly Oil Inventory Report – Key Highlights and Market Takeaways
EIA Crude Oil Inventories:
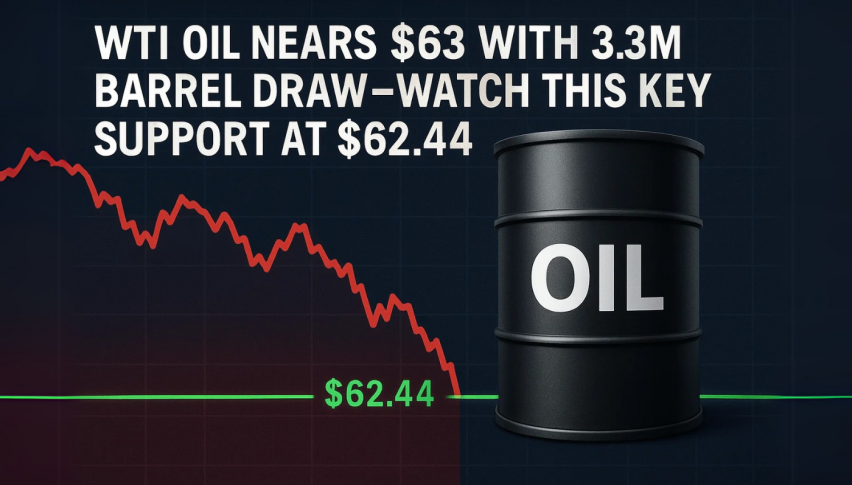
- U.S. crude stockpiles fell by 4.304 million barrels in the past week, significantly larger than the 1.035 million barrel draw analysts had expected.
- Prior week’s draw: 2.795 million barrels
- This steeper-than-expected draw initially looked bullish for crude markets.
Gasoline Inventories:
- Inventories rose sharply by 5.219 million barrels, far surpassing the expected 609,000 barrel build.
- This is a concerning sign of weaker-than-anticipated gasoline demand or potential refinery overproduction.
- Distillate Inventories (including diesel):
Also saw a large build, up 4.230 million barrels, well above the consensus of 1.018 million barrels. - Suggests either soft industrial demand or heavy seasonal refining activity ahead of summer.
API (American Petroleum Institute) Estimates – Released Tuesday Evening:
- Crude: -3.3 million barrels (in line with bullish EIA report)
- Gasoline: +4.7 million barrels
- Distillates: +760,000 barrels
- API data hinted at product builds but underestimated the scale seen in official EIA numbers.
Both WTI and Brent are down by about 80 cents. The inability to maintain momentum above moving averages reinforces a cautious tone among traders, many of whom remain wary of macroeconomic headwinds and weakening demand signals. Unless there is a fresh catalyst—such as a geopolitical shock, deeper OPEC+ cuts, or a surprise drawdown in U.S. stockpiles—crude oil appears vulnerable to further downside pressure in the near term.
Market Takeaway:
While the headline crude drawdown looks bullish, the massive builds in gasoline and distillates are raising red flags for demand-side fundamentals. The discrepancy between falling crude inventories and ballooning product stockpiles could point to weaker downstream consumption, particularly in transportation and industrial sectors.
Traders may interpret this as a mixed signal: tightness in crude supply (perhaps due to OPEC+ cuts or lower imports) but a possible slowdown in U.S. end-user demand. If this trend continues, it could cap any sustained rally in oil prices, especially with refinery output remaining elevated into the summer.
Expect short-term price volatility, with crude potentially supported near-term, but gasoline/diesel weakness weighing on refining margins and sentiment.
US WTI Crude Oil Live Chart
- Check out our free forex signals
- Follow the top economic events on FX Leaders economic calendar
- Trade better, discover more Forex Trading Strategies
- Open a FREE Trading Account