Gold Price Prediction Weekly: Deeper Retreat Before Uptrend Resumes?
Gold prices have dipped after reaching record highs earlier this year, despite improved global sentiment—but underlying support zones sugges

Quick overview
- Gold prices have cooled after reaching an all-time high of $3,500 per ounce in April 2025, entering a consolidation phase amid improved global sentiment.
- Recent economic data has shown gold's sensitivity, with a brief rally following weaker U.S. figures, but a solid nonfarm payrolls report led to a retreat in prices.
- Despite the recent pullback, gold remains technically supported, with key levels suggesting potential for a bullish reversal if economic conditions shift.
- The current weakness in gold appears to be temporary, with ongoing macroeconomic factors likely to sustain its appeal in the medium term.
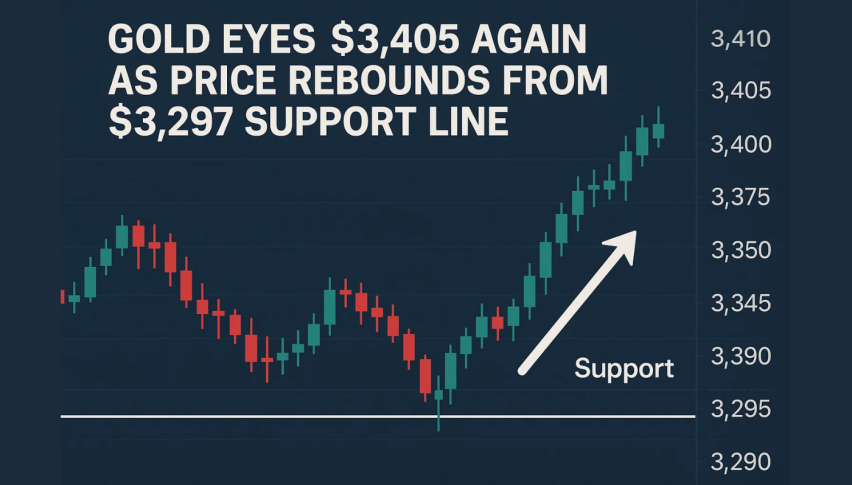
Live GOLD Chart

Gold prices have dipped after reaching record highs earlier this year, despite improved global sentiment—but underlying support zones suggest that the positive trend may resume soon.
Gold Takes a Breather After Record Highs
Gold (XAU/USD) has shown notable resilience in 2025, rallying to an all-time high of $3,500 per ounce in April. However, the precious metal has since entered a consolidation phase as global markets shift into a more optimistic risk-on mode.
A wave of improved sentiment—bolstered by de-escalating U.S.-China tensions and stronger stock market performance—has temporarily pulled capital away from traditional safe-haven assets like gold.
Gold Chart Monthly – May’s Doji Candlestick Suggests A Deeper Pullback

This change in tone has resulted in a corrective move for gold prices, which are now hovering between $3,120 and $3,400. While the euphoria in equities has dampened near-term demand, the broader macroeconomic landscape and technical structure continue to support a long-term bullish outlook for GOLD .
Risk Sentiment and Data Weigh on Gold
Last week provided a clear view of gold’s sensitivity to shifting economic data. On Wednesday, weaker-than-expected U.S. figures gave the metal a short-lived boost. Business activity in the services sector contracted for the first time in over a year, and private hiring slowed, according to the ISM and ADP reports. These developments pushed gold higher by over 0.8% in North American trading, as markets began to price in a softer economic outlook.
However, the rally was cut short on Friday after a surprisingly solid nonfarm payrolls report. Despite underlying weakness in some sectors, the U.S. economy added 139,000 jobs in May—beating the forecast of 130,000—and the unemployment rate held steady at 4.2%. This alleviated immediate concerns about a broader slowdown and sparked a retreat in gold prices, which fell over 1% by the end of the session.
Technical Landscape: Strong Support Below

Technically, gold remains well-supported despite the recent pullback. The daily chart shows that the 50-day simple moving average (SMA), currently around $3,255, has served as reliable support in recent months. With prices now drifting back toward this level, traders may be watching closely for signs of stabilization or bullish reversal patterns.
The broader range since late April suggests a market in search of direction—but with lower volatility and a narrowing band, any shift in economic expectations or a renewed spike in geopolitical tension could catalyze a fresh rally. A decisive break above $3,400 could see gold reattempt the $3,500 high, while a drop below $3,120 may trigger more aggressive dip-buying.
Outlook: A Temporary Retreat in a Long-Term Rally
The current gold weakness appears more corrective than structural. As long as inflation remains sticky, growth slows modestly, and global risks simmer just beneath the surface, gold should retain strong appeal over the medium term. The ongoing consolidation may, in fact, present a strategic entry opportunity for investors who missed the earlier rally.
In short, gold’s rally may have paused—but it hasn’t ended. The recent drop is likely a reflection of temporary shifts in sentiment rather than a reversal of the broader trend. With key support levels intact and macro tailwinds still in play, a deeper pullback could soon give way to renewed bullish momentum.
Gold Live Chart
- Check out our free forex signals
- Follow the top economic events on FX Leaders economic calendar
- Trade better, discover more Forex Trading Strategies
- Open a FREE Trading Account