Bitcoin Poised for $110K Breakthrough: Technical Indicators Flash Bullish Signals Despite Macro Headwinds
Bitcoin is still showing amazing strength, trading above $109,000 and gaining about 4% in the last 24 hours. The world's most popular crypto
Quick overview
- Bitcoin is currently trading above $109,000, showing a 4% increase in the last 24 hours and nearing its all-time high.
- MicroStrategy has added 1,045 BTC to its holdings, indicating strong institutional demand and contributing to a supply squeeze.
- Technical analysis suggests a potential breakout toward $120,000, although macroeconomic uncertainties may limit short-term gains.
- Long-term holders are accumulating Bitcoin, while short-term holders are selling, indicating a shift in market sentiment towards stronger hands.
Bitcoin BTC/USD is still showing amazing strength, trading above $109,000 and gaining about 4% in the last 24 hours. The world’s most popular cryptocurrency is only 3% behind its all-time high of $111,965. Technical analysis shows that it could break out toward $120,000, but macroeconomic uncertainty could restrict short-term gains.
Corporate Demand Intensifies: Strategy Adds 1,045 BTC to Holdings
The price of Bitcoin stays stable because institutions keep using it. MicroStrategy, which has changed its name to Strategy, recently bought 1,045 more Bitcoin for around $110.2 million, or about $105,426 per coin. With its most recent purchase, the business now owns 582,000 BTC, which it bought for $40.79 billion at an average cost of $70,086.
The corporate giant’s methodical accumulation technique keeps taking supply off the market. For example, over-the-counter desk inventories have dropped from 236,000 BTC a month ago to just 123,500 BTC now. This supply squeeze, along with the fact that 124 major firms already have Bitcoin on their balance sheets, sets the stage for prices to keep going up.
BTC/USD Technical Analysis: Bullish Breakout Pattern Emerges
The weekly chart for Bitcoin shows a strong Doji candle pattern, which has a small body and long wicks and usually comes before big price changes. The fact that sell-side liquidity has been absorbed during the past three weeks shows that bearish pressure has run its course, which could lead to a rise.
Krillin, a crypto expert, has found a fractal relationship between the way Bitcoin is acting now and the way it acted when the spot ETF was approved in January 2024. Historically, these self-repeating patterns on higher timeframes have been 70-80% accurate at predicting trend reversals. The current setup suggests that the price could rise to $110,000-$120,000.
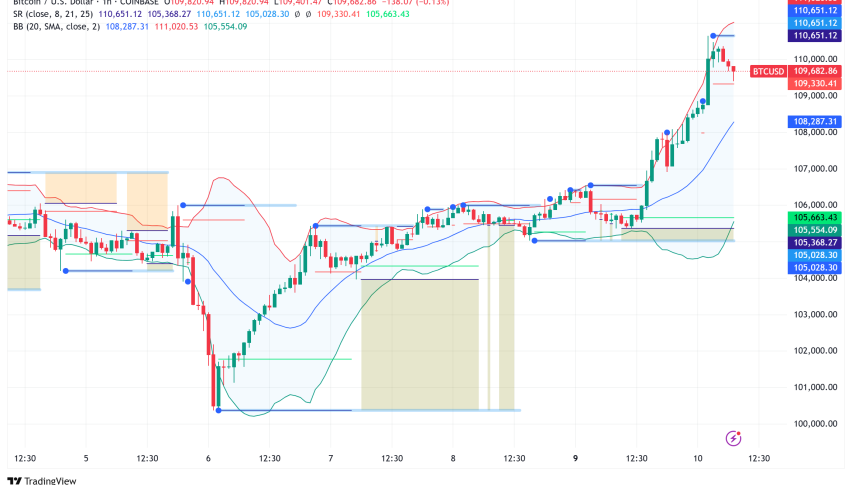
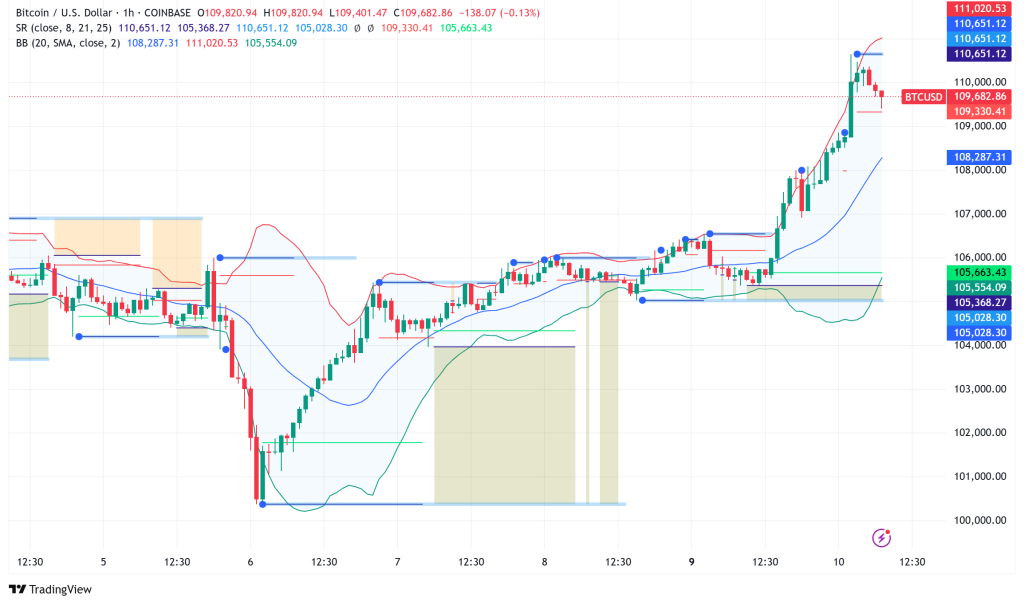
Bitcoin is trading above the 100-hour simple moving average on the hourly chart, and a bullish trendline is developing support at $106,850. The first level of resistance is at $110,500. If this level is broken, the price could go up to $112,500 or higher.
HODL Mode Returns as Long-Term Holders Accumulate Bitcoin
The mood of the market has clearly changed to accumulation, and spot trading volumes on controlled exchanges have dropped to levels not seen since October 2020. The current spot volume of $965.6 million, which is lower than the high futures volume, suggests that investors are going into “HODL mode.” This is a trend that has happened before Bitcoin’s huge run in late 2020.
Onchain data shows an interesting difference between short- and long-term holders. In the last 30 days, short-term holders have given up 592,000 BTC, while long-term holders (wallets that have been inactive for more than 155 days) have added 605,000 BTC since the all-time high. This change from weak to strong hands usually means that prices will stay high because of structural support.
Macroeconomic Headwinds Could Cap Near-Term Gains
Bitcoin has some big problems in the economy, even when technical signs are positive. Bitcoin’s price changes are directly affected by changes in the S&P 500, which has an 82% connection with the cryptocurrency. Bitcoin’s relationship to risk assets could make it hard for it to stay over $110,000 as fears of a recession and trade tensions around the world rise.
The Bitcoin long-to-short margin ratio at OKX reveals that there are four longs for every short, which is a neutral reading. In the past, this ratio has been as low as 5:1 (bearish) and as high as 20:1 (very optimistic). This indicator doesn’t show that a crash is about to happen, but it does show that leveraged traders are feeling more measured than ecstatic.
Bitcoin Price Prediction: Cautious Optimism Amid Structural Bullishness
Technical analysis strongly suggests that Bitcoin will break above $110,000. If it does, it might go as high as $115,000 to $120,000. The combination of companies buying up stocks, supply problems, and bullish chart patterns makes a strong case for higher prices.
But macro hazards are still the most important. If predictions of a recession come true or trade tensions rise, Bitcoin’s link to traditional markets might cause a lot of downward pressure. The main support levels are $108,000, $106,500, and $103,500. If the price drops below $102,000, it might mean that the market is getting more pessimistic.
In the near future, Bitcoin will probably stay between $105,000 and $112,000. For a big breakout to happen, the market needs to be stable and more institutions need to start using it. Long-term holders buying during the recent dip shows that the structural underpinning is still strong enough for fresh all-time highs above $115,000 in the future.
- Check out our free forex signals
- Follow the top economic events on FX Leaders economic calendar
- Trade better, discover more Forex Trading Strategies
- Open a FREE Trading Account