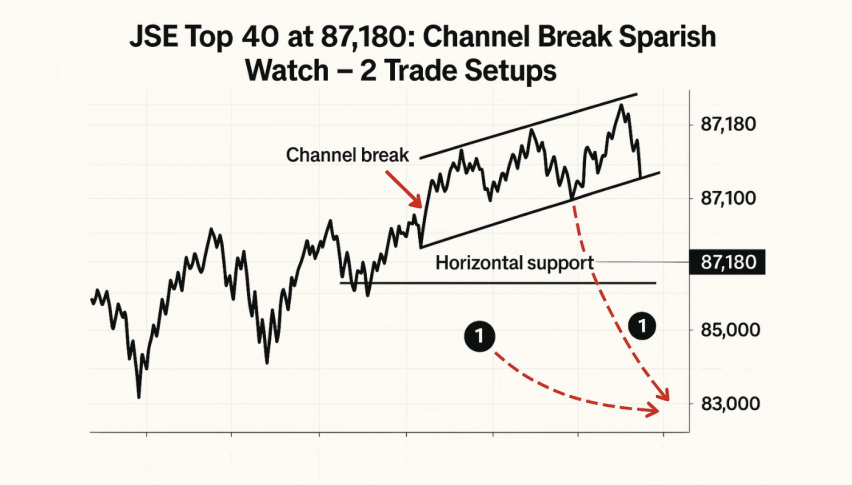
JSE Top 40 at 87,180: Channel Break Sparks Bearish Watch – 2 Trade Setups
JSE Top 40 slipped sharply after breaking the bullish rising channel that had supported its rise since mid‑May. Now hovering near 87,180
Quick overview
- The JSE Top 40 index has sharply declined after breaking its bullish rising channel, currently trading near 87,180.
- A bearish engulfing candlestick pattern has formed, with the MACD showing deep negativity but early signs of flattening.
- Global tensions and the Federal Reserve's cautious stance have led to a sell-off in South Africa's equity sectors, causing the rand to weaken.
- Traders are advised to watch for potential breakout or breakdown scenarios around the 87,700–88,100 range for clearer trading signals.
JSE Top 40 slipped sharply after breaking the bullish rising channel that had supported its rise since mid‑May. Now hovering near 87,180, the index trades below the 50‑period EMA at 87,773 and key support‑turned‑resistance around 88,100.
The sudden drop triggered a bearish engulfing candlestick, and the MACD is deeply negative, though its histogram shows early signs of flattening. That suggests the downward momentum may pause, but there’s no clear bullish reversal yet.
Rand and Emerging‑Market Stress
Global anxiety, fueled by soaring Middle‑East tensions and the Federal Reserve’s cautious stance, has pushed capital out of riskier assets. South Africa’s equity sectors, led by banking, mining, and industrials, slid as investors sought safety.
The 2035 SA government bond yield rose to 10.16%, signaling a rise in risk premiums. At the same time, the rand weakened ahead of today’s SARB Financial Stability Review, following last month’s rate cut amid persistent uncertainties in trade and U.S. policy.
Trade Strategy for Novices
For traders considering a clear setup, here are two scenarios:
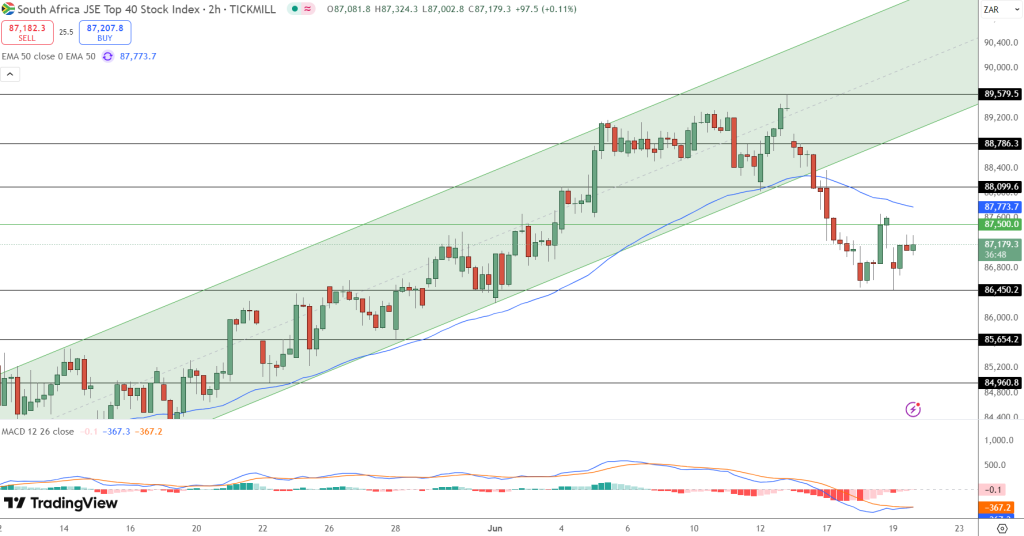
- Bullish: A close above 88,100 with rising volume and a reclaim of the 50‑EMA could signal a long entry. Targets lie at 88,786 and 89,579, with a stop‑loss below 86,450.
- Bearish: If the 87,700–88,100 range sees rejection via a shooting star or bearish engulfing candle, a short toward 86,450 and 85,654 may be prudent. A stop above 88,200 would manage risk.
Until either breakout or breakdown materializes, the Top 40 remains trapped in indecision. Traders should keep a close eye on the EMA’s reaction and any MACD crossover for directional cues. Stay alert—clear signals are forming.
- Check out our free forex signals
- Follow the top economic events on FX Leaders economic calendar
- Trade better, discover more Forex Trading Strategies
- Open a FREE Trading Account