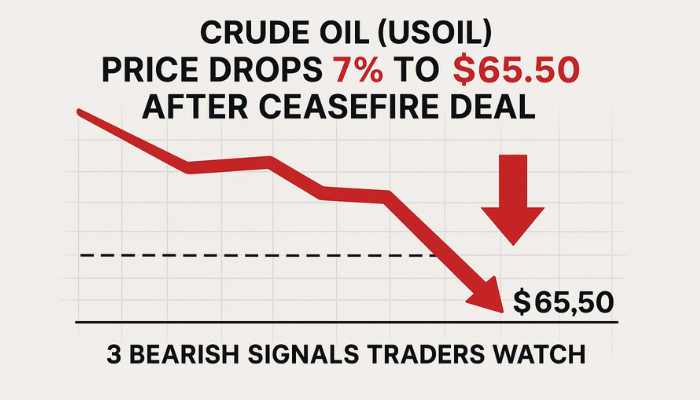
Crude Oil (USOIL) Price Drops 7% to $65.50 After Ceasefire Deal—3 Bearish Signals Traders Watch
WTI crude fell below $66.20 on Tuesday, its lowest in nearly two weeks, after US President Donald Trump announced a ceasefire between...
Quick overview
- WTI crude oil prices fell below $66.20 after a ceasefire was announced between Israel and Iran, marking the lowest price in nearly two weeks.
- The ceasefire followed Iran's missile strikes on a US base in Qatar, which shifted market sentiment and reduced fears of disruptions in oil shipments through the Strait of Hormuz.
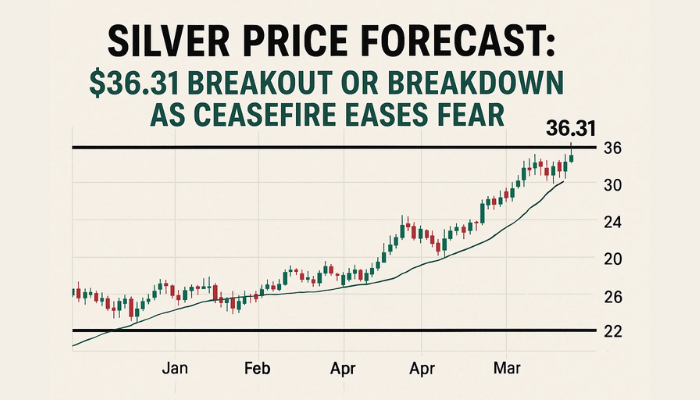
- Technically, WTI crude has broken lower from a rising wedge pattern, indicating a bearish momentum shift with key resistance at the 50-period EMA of $71.78.
- Traders should be cautious as further declines could occur unless bullish signals emerge, with key support levels identified at $64.40 and $62.87.
WTI crude fell below $66.20 on Tuesday, its lowest in nearly two weeks, after US President Donald Trump announced a ceasefire between Israel and Iran. The truce, which started with Iran halting strikes and Israel complying, will end the 12-day conflict in 24 hours.
Timing was everything. Just hours before the ceasefire, Iran launched missiles at a US base in Qatar after airstrikes on its nuclear facilities. Although no one was hurt due to successful US interceptions, the narrative shifted fast.
Iran blocking the Strait of Hormuz, a critical channel for 20% of global oil shipments, is no longer a threat. That’s pulled the floor out from under oil prices.
USOIL Bearish Pattern Confirms Momentum Shift
From a technical perspective, WTI crude (USOIL) has broken lower. The chart shows a breakdown from a rising wedge, a bearish reversal pattern, and a steep fall from $73.70 to just above $65.50.
More importantly, a Three Black Crows pattern has formed on the 2-hour chart. Three large bearish candles means aggressive selling. The 50-period EMA ($71.78) is now resistance. The MACD is bearish with a deep negative crossover and expanding red bars, momentum is clearly down.
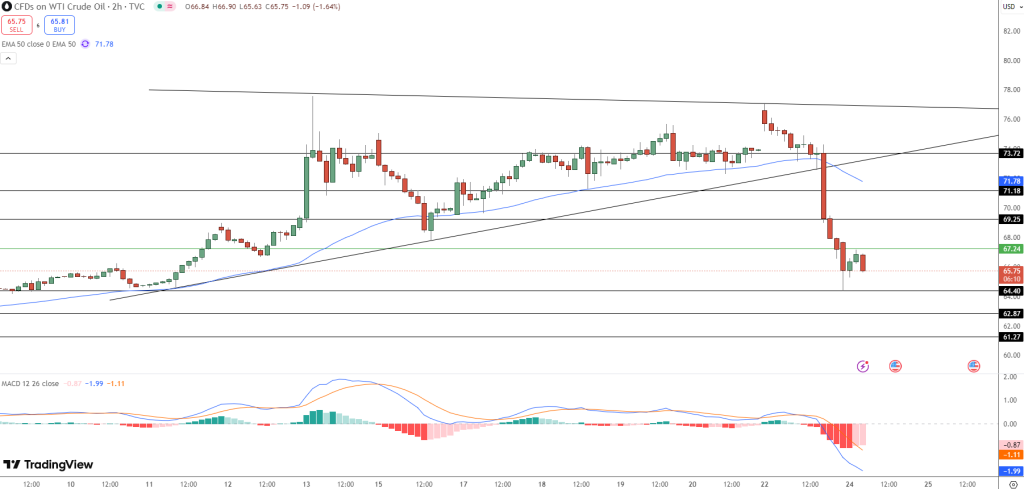
- EMA Trend: 50-EMA flipped bearish
- MACD: Crossover + deep red histogram
- Key Support Levels: $64.40, $62.87, and $61.27
- Pattern Watch: Three Black Crows + wedge breakdown
Crude Oil Trade Outlook: More Pain or a Pause?
Unless bulls can get back in quickly with a bullish engulfing or hammer, oil’s decline may not be over. A rejection at $67.25 could mean more down to $64.40 and $62.87. A conservative short entry here with a stop above $69.25 is a good risk-reward. But traders be aware, technicals matter but headlines move this market.
- Check out our free forex signals
- Follow the top economic events on FX Leaders economic calendar
- Trade better, discover more Forex Trading Strategies
- Open a FREE Trading Account