Bitcoin Struggles at $110K Resistance: Technical Divergences Signal Potential Pullback
Bitcoin (BTC) is currently trading above $109,000, maintaining relative stability over the past 24 hours despite encountering significant
Quick overview
- Bitcoin is trading above $109,000 but faces significant resistance at the $110,000 level, raising concerns about the sustainability of its rally.
- Technical analysis shows bearish divergences across multiple timeframes, indicating a potential slowdown in bullish momentum.
- Market sentiment remains cautiously neutral, with selling pressure increasing around the $110,000 resistance, suggesting traders are hesitant about the current breakout.
- Despite the uncertainty, Bitcoin's long-term trend remains bullish, but immediate support levels are critical to watch for potential pullbacks.
Bitcoin BTC/USD is currently trading above $109,000, maintaining relative stability over the past 24 hours despite encountering significant technical resistance at the psychologically important $110,000 level. While the cryptocurrency briefly spiked to $110,578 on Friday, multiple bearish divergences across various timeframes are raising concerns about the sustainability of the current rally.
BTC/USD Technical Analysis Reveals Weakening Momentum
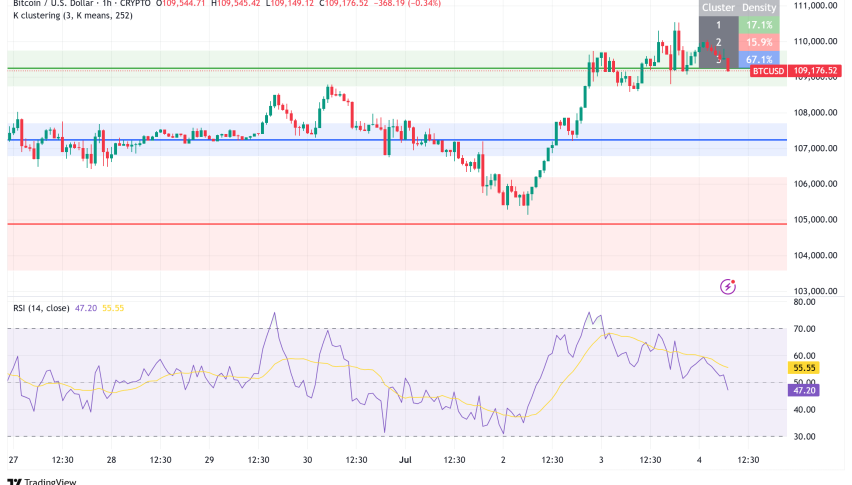
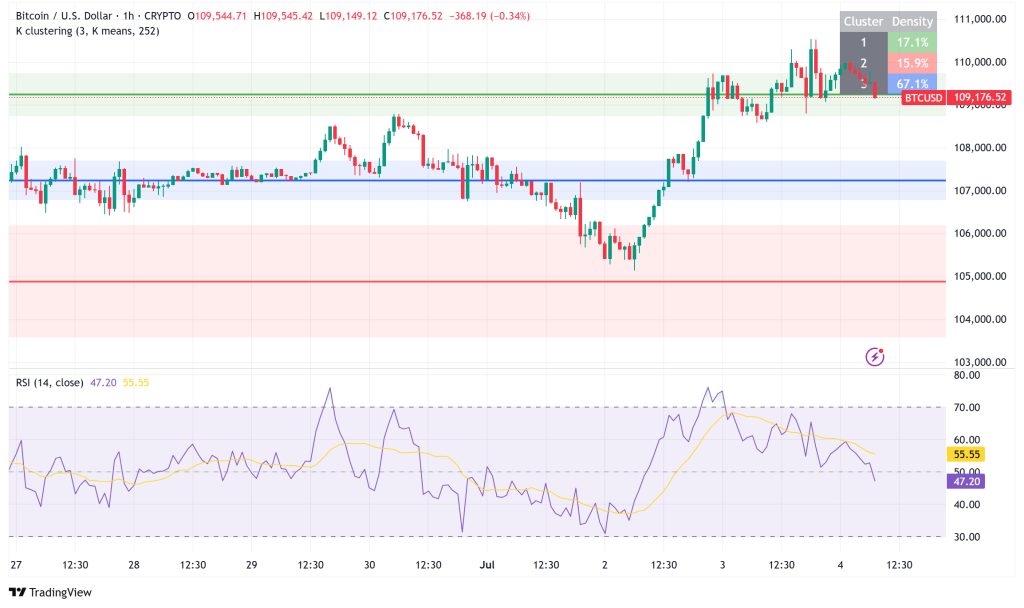
The technical picture for Bitcoin is mixed, but it is becoming more and more cautious. Analysts have found negative divergences on the 15-minute, one-hour, and four-hour charts. These show that the price keeps going up while momentum indicators like the Relative Strength Index (RSI) move down. This divergence pattern usually means that bullish momentum is slowing down and makes a correction more likely in the near future.
The one-day chart backs up these worries by showing a significant bearish divergence that started in May and lined up with Bitcoin’s last all-time high of $111,800. BTC has gone below $100,000 a few times since then, but this divergence is still there, which means that bearish pressure could still affect market action. Technical analysts have found immediate downside targets in the range of $107,500 to $106,000.
The rejection at the $110,000 psychological barrier after Friday’s US Non-Farm Payroll data was better than expected could mean that the current range highs are becoming tired. The robust labor report helped BTC rise to $110,000 at first, but bulls couldn’t keep the breakout going, which could mean that the current upswing is fragile.
Market Sentiment Remains Cautiously Neutral
K33’s Vetle Lunde said that even if Bitcoin is trading close to its all-time high, funding rates are still very neutral. Even if BTC is close to its all-time high range, the perpetual futures financing rate hasn’t changed. This means that traders aren’t completely sure that the breakout will last. This lack of aggressive long positioning fits with the current technical divergences and backs up a more cautious view of the market.
Market order books are starting to show more selling pressure, with a lot of high-taker sell activity showing up around the $110,000 level. This usually means that investors are closing their holdings at resistance levels. This is similar to what happens when prices are near prior all-time highs, when rejection zones often attract liquidity for exits.
Conflicting Signals Create Trading Uncertainty
The market right now is sending out mixed signals that are stopping traders from agreeing on what Bitcoin’s next big move will be. Some observers, including the pseudonymous trader Byzantine General, think that Bitcoin might be getting ready to break above $112,000 based on futures data. They say that open interest might also break out along with price action.
But some traders refer to Bitcoin’s recent record of doing liquidity sweeps above resistance levels and below support levels, only to quickly change direction. These fakeouts are often meant to get rid of leveraged positions before a real directional shift happens, which makes the present technical picture even more complicated.
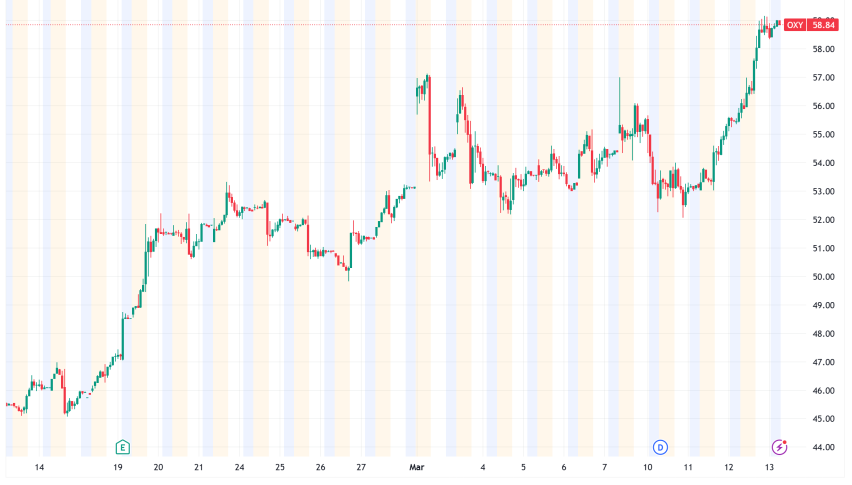
BTC Mining Stocks Provide Positive Backdrop
The price of Bitcoin is still up in the air, but the rest of the crypto ecosystem got a boost from a big increase in mining stocks. Over the past four trading days, major mining businesses like Riot Platforms (RIOT), Hive Digital (HIVE), Hut 8 (HUT8), MARA Holdings (MARA), and Bitfarms (BITF) saw their stock prices rise between 13% and 28%.
This rise was spurred by news that a good macroeconomic environment could back up the Federal Reserve’s story of a “soft landing.” The VanEck Digital Transformation ETF, which follows 24 publicly traded digital asset companies, was up by as much as 3.2% on Thursday. This shows that more institutions are interested in the crypto area.
Bitcoin Price Prediction and Key Levels to Watch
Bitcoin is currently facing strong barrier at $110,000–$110,500, and if bulls can keep breaking through, the next significant resistance level is at $112,000–$113,200. But the weight of the technical data implies that we should be more careful.
The bad news is that immediate support is at $109,500 (the channel trend line), next at $108,800, and finally at the important $107,850 level (50% Fibonacci retracement). If the price goes below these levels, it could go down to the $106,400 support zone, where there is strong support at $105,000.
Bearish divergences across multiple timeframes, neutral funding rates, and more selling pressure at resistance all point to a pullback toward the $106,000-$107,500 range before any sustained move higher, even though Bitcoin is still in a bullish long-term trend. As Bitcoin goes through this important stage in its price discovery process, traders should keep a close eye on these important technical levels.
- Check out our free forex signals
- Follow the top economic events on FX Leaders economic calendar
- Trade better, discover more Forex Trading Strategies
- Open a FREE Trading Account
- Read our latest reviews on: Avatrade, Exness, HFM and XM
Related Articles


Sidebar rates
Related Posts
