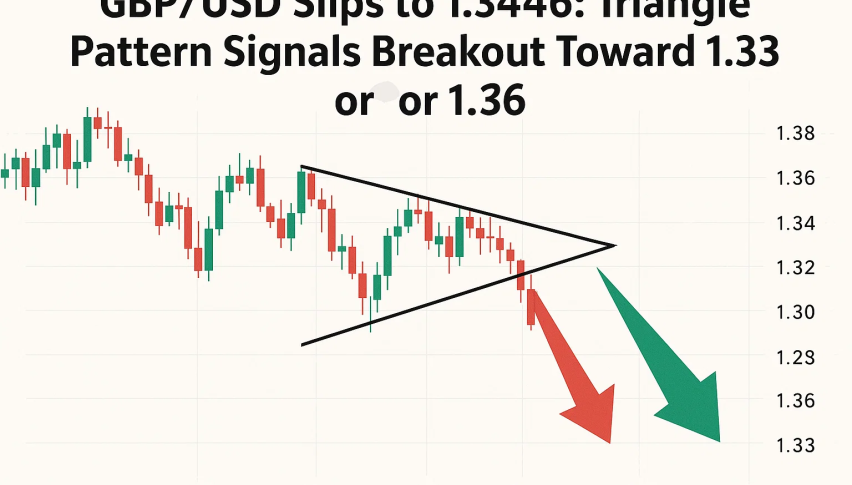
GBP/USD Slips to 1.3446: Triangle Pattern Signals Breakout Toward 1.33 or 1.36
The pound is down against the dollar, trading at 1.3446, from last week’s 1.3553 high. The decline is part of broader dollar strength...
Quick overview
- The pound has declined against the dollar, trading at 1.3446 due to broader dollar strength and political uncertainty.
- President Trump's firing of Federal Reserve Governor Lisa Cook raises concerns about the Fed's independence and credibility.
- Investors are anticipating the July PCE Index, which could influence expectations for a potential rate cut at the September meeting.
- GBP/USD is currently in a symmetrical triangle pattern, indicating an imminent breakout, with key resistance and support levels identified.
The pound is down against the dollar, trading at 1.3446, from last week’s 1.3553 high. The decline is part of broader dollar strength as investors wait for key data. US equities and cryptocurrencies are also weaker.
Political uncertainty added to the mix. President Trump fired Federal Reserve Governor Lisa Cook, a move seen as undermining central bank independence. Analysts think Trump may be looking for a Fed more in line with his economic agenda. While the Fed has faced political pressure before, this latest move has heightened concerns about its credibility at a time when markets are already nervous.
Fed Rate Cut Bets Drive Market Moves
Now investors are looking to the July Personal Consumption Expenditures (PCE) Index on Friday. As the Fed’s preferred measure of inflation, the release will shape expectations ahead of the September meeting. Current market pricing via the CME FedWatch tool is 84% for a 25-bp cut.
But risks remain. A surprise inflation pop could delay easing, while weak jobs data has already tilted sentiment towards rate cuts. Earlier revisions to US payrolls showed labor market cracks, and expectations are for the Fed to act fast to support growth.
Across the Atlantic, the Bank of England has its own problem. Inflation is still high, so rate cuts are less likely in the near term. Last month the BoE cut its rate to 4% but policymakers are divided on how much to ease going forward.
GBP/USD Technical Outlook: Triangle Breakout Ahead
From a charting perspective, GBP/USD is coiled in a symmetrical triangle. The pair has been capped by lower highs from 1.3594 and supported by higher lows above 1.3347. This compression means a breakout is imminent.
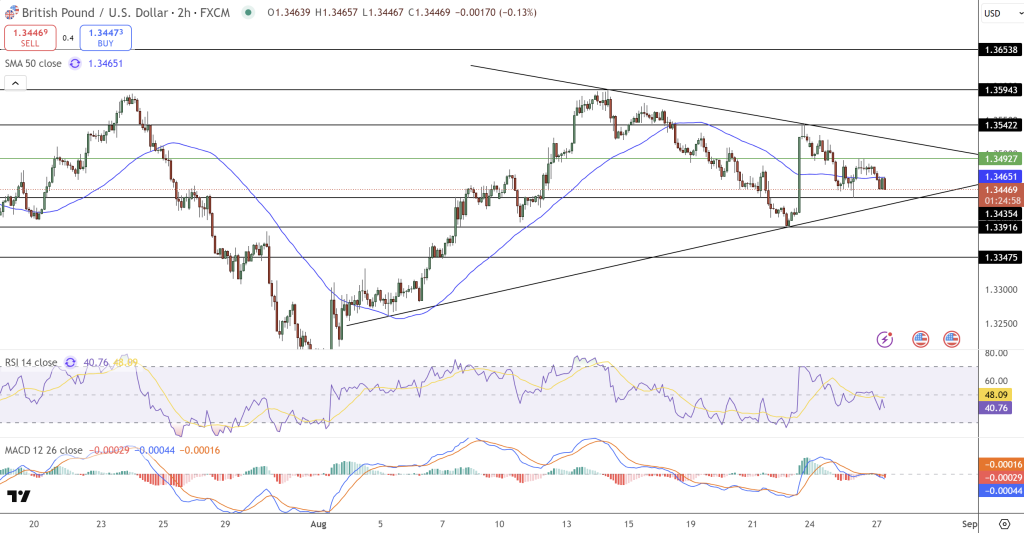
- Resistance: 1.3465 (50-SMA), 1.3492 (upper triangle boundary)
- Support: 1.3391 (trendline), 1.3347 (major floor), 1.3300 (deeper risk)
- Indicators: RSI near 40 suggests fading demand; MACD flat below zero signals weak momentum.
So for traders, it’s simple. Below 1.3391 and losses accelerate to 1.3347 and 1.3300. Above 1.3492 and bullish momentum to 1.3542-1.3594. Until then, the pound is range bound and the next candle will decide.
- Check out our free forex signals
- Follow the top economic events on FX Leaders economic calendar
- Trade better, discover more Forex Trading Strategies
- Open a FREE Trading Account