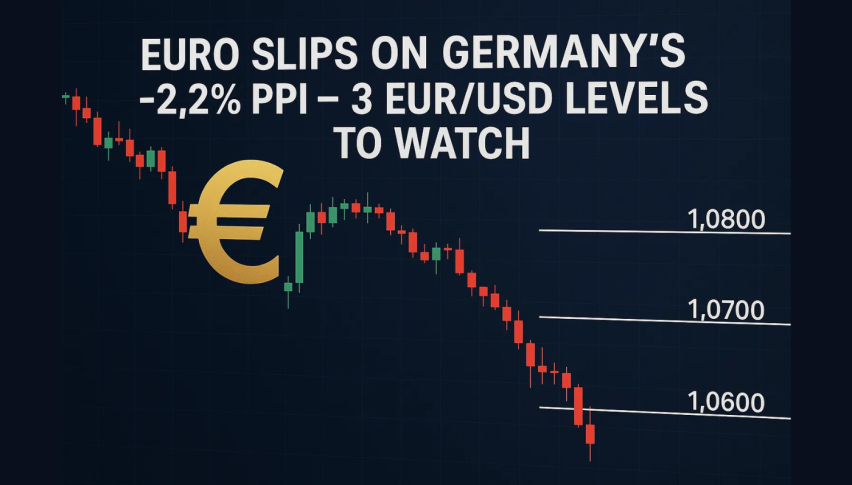
Euro Slips on Germany’s -2.2% PPI — 3 EUR/USD Levels to Watch
Germany’s PPI fell 2.2% yoy in August, more than July’s -1.5% and below the -1.6% expected. On the month, prices dropped 0.5% instead...
Quick overview
- Germany's PPI fell 2.2% year-over-year in August, indicating ongoing disinflation at the factory level.
- The decline in producer prices suggests lower input costs for manufacturers, which may eventually ease consumer prices.
- The euro's reaction to weak PPI data could lead to lower front-end yields and concerns about slowing economic activity.
- Technically, EUR/USD shows signs of fatigue, with bearish patterns indicating potential further declines unless key resistance levels are reclaimed.
Germany’s PPI fell 2.2% yoy in August, more than July’s -1.5% and below the -1.6% expected. On the month, prices dropped 0.5% instead of rising. For the biggest economy in the euro area, that’s another notch of disinflation at the factory gate. Lower input costs tend to filter into consumer prices with a lag, which is why currency and rates markets care: softer pipeline inflation gives central banks more room to stay patient. In short, manufacturers are paying less, and that cools the broader pricing pulse.
The mix matters for sentiment. Falling PPI relieves pressure on margins but also hints at soft demand across Europe’s supply chains. For the ECB, it keeps policy firmly data-dependent. For FX, it means the euro takes its cues from inflation relief on one hand and growth worries on the other.
Why PPI Matters for the Euro
The euro’s immediate reaction to weak PPI is usually two-fold. First, the rates channel: if traders see less need for tighter policy, front-end yields ease and the euro can fall.
Second, the growth channel: cheaper producer prices sometimes signal slower orders—another weight on the currency if investors fear activity is slowing. That’s why today’s print arrives at a sensitive moment for EUR/USD, which had rallied earlier this week before momentum stalled.
Context helps: disinflation doesn’t mean a straight line lower for the euro. If energy stabilizes and services hold up, the currency can still find buyers on dips. But until trend evidence turns, the burden of proof is on the bulls.
EUR/USD Levels and Trade Setup
Technically, EUR/USD is showing classic fatigue after a strong run. The pair topped near 1.1847 and printed several shooting-star rejections, then broke below a rising trendline, flipping structure from bullish to corrective.
A bearish engulfing near 1.1812 started a series of red candles like three black crows, a pattern that often means sustained selling. Momentum confirms: with RSI below 50 and shorter EMAs under longer ones, the path of least resistance is down unless buyers reclaim overhead supply.
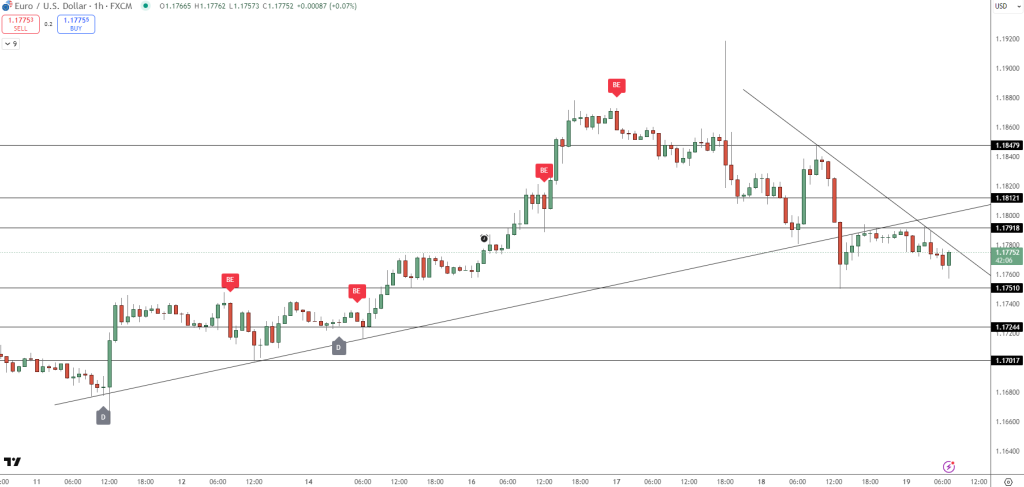
- Immediate support: 1.1751; a clean hourly/4H close below exposes 1.1724 and then 1.1701* Near resistance: 1.1791; above 1.1812 neutralizes the bearish view
- Momentum says: RSI < 50 and a pending bearish EMA crossover means rallies are suspect
- Risk level: if 1.1751 fails, the trend shifts to 1.1701
Trade idea: Short only if 1.1751 closes. Target 1.1724 first and 1.1701 if momentum continues. Stop above 1.1812, the bearish engulfing origin and nearby resistance. Want a more conservative entry?
Wait for 1.1751 to be retested from below (old support becomes new resistance) before committing. If 1.1812 is reclaimed, step aside; a daily close back above that level invalidates the trade and means range repair instead of continuation.
- Check out our free forex signals
- Follow the top economic events on FX Leaders economic calendar
- Trade better, discover more Forex Trading Strategies
- Open a FREE Trading Account
- Read our latest reviews on: Avatrade, Exness, HFM and XM
Related Articles

Sidebar rates
Related Posts
