Humana Inc. (NYSE: HUM) is a major U.S. health and well-being company, headquartered in Louisville, Kentucky, with a dominant presence in the Medicare Advantage space. From an analyst’s perspective, Humana’s positioning at the intersection of insurance and service delivery makes it a pivotal player in a sector where cost efficiency, regulatory shifts, and demographic tailwinds (aging population) drive both risks and opportunities. However, the stock has recently experienced a significant decline.
Humana Inc. (HUM) Stock Forecast: Golden Ratio Support Tested as Downtrend Persists
•
Last updated: Sunday, September 21, 2025

Quick overview
- Humana Inc. has experienced a significant decline of nearly 63% over the past three years, reaching critical support levels.
- The stock is currently at a pivotal point, with immediate support at $245 and a key golden ratio support at $200.
- Resistance levels to monitor include $292, $346, and $444, while momentum indicators show mixed signals.
- The MACD histogram trends lower, indicating bearish momentum, but the MACD lines remain in a bullish crossover, suggesting potential underlying strength.
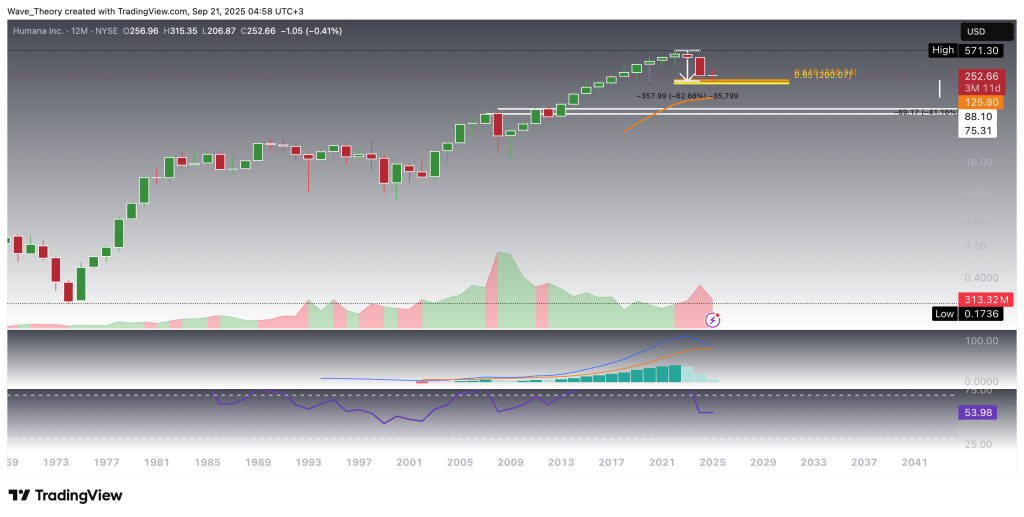
Humana Inc. (NYSE: HUM) has undergone a steep correction, declining nearly 63% over the past three years. This drawdown has now driven the stock into a critical inflection point: the golden ratio support level at $200, which aligns with the long-term Fibonacci retracement drawn from the all-time low (ATL) to the all-time high (ATH) spanning the past 55 years. This confluence makes the $200 zone a structurally significant support area, where the probability of a technical rebound increases materially.
Should this level fail to hold, however, the chart opens up to further downside of approximately 41%, with the next major demand zone resting in the horizontal support band between $75.3 and $88.1. Before reaching that region, the 50–12 month EMA provides an additional layer of support around $125.8, which could act as an intermediate floor.
Momentum indicators remain weak. The MACD histogram has been trending lower for three consecutive years, reflecting sustained bearish momentum, while the MACD lines are on the verge of confirming a bearish crossover. Meanwhile, the RSI sits in neutral territory, offering neither bullish divergence nor oversold signals at this stage.
Taken together, Humana is at a decisive technical juncture: either defending its long-term golden ratio support at $200 to stage a recovery, or breaking lower into a continuation of its prolonged downtrend.
Humana Inc. (NYSE: HUM) Faces Key Fibonacci Resistances
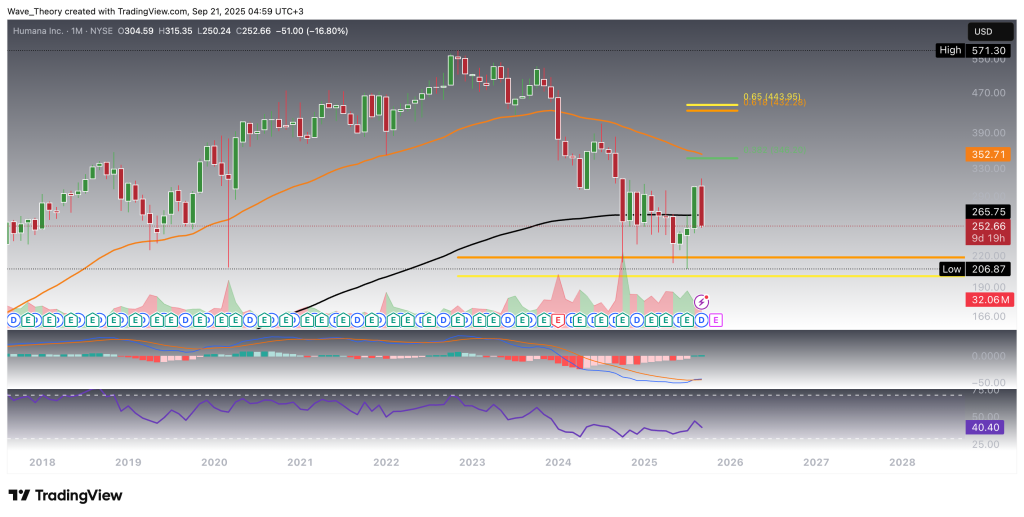
Over the past three months, HUM has staged a bullish rebound off the golden ratio support at $200. However, this month the stock appears to be resuming its downward trajectory. To fully invalidate the prevailing long-term downtrend, HUM must first overcome critical Fibonacci resistance levels at $346.2 and $444. Adding to the overhead pressure, the 50-month EMA aligns as an additional resistance zone at $352.7.
On the momentum side, the MACD histogram has been trending steadily higher, with both the MACD lines and EMAs already in bullish crossover, reinforcing a constructive outlook for the longer term. At the same time, the RSI remains neutral, offering no immediate bullish or bearish divergence.
In short, while Humana’s technicals have improved from the $200 base, the stock now confronts formidable resistance zones that will determine whether this rebound evolves into a sustainable trend reversal or reverts back into broader weakness.
Humana Inc. (NYSE: HUM) Hits Immediate Golden Ratio Support
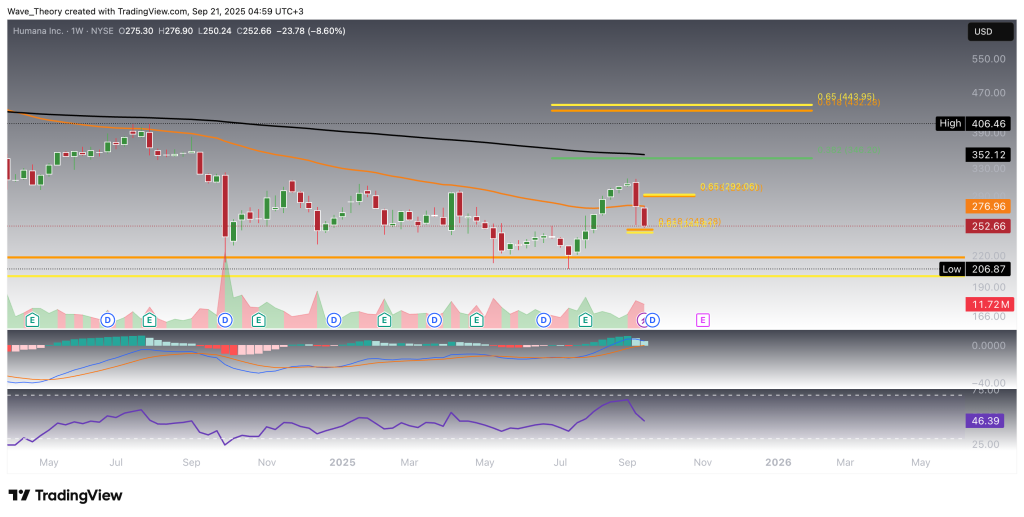
HUM has now reached another golden ratio support at $245, a level from which a bullish reaction is possible. Should this zone hold, the stock’s immediate upside target lies at the golden ratio resistance at $292. A confirmed breakout above this level could open the path toward the next significant Fibonacci resistances at $346 and $444, with the 200-week EMA adding further resistance at $352. Conversely, failure to sustain $245 would expose the stock to renewed downside risk, with the $200 golden ratio support serving as the next major level to watch.
From a momentum perspective, the signals are mixed. The MACD histogram has been trending lower since last week, while the EMAs have formed a death cross, reinforcing bearish momentum in the mid-term. In contrast, the MACD lines remain in a bullish crossover, suggesting underlying strength, while the RSI continues to move within neutral territory without signaling overbought or oversold conditions.
Taken together, HUM stands at a technically pivotal juncture: holding $245 could spark another recovery leg, while a breakdown would shift focus back to the $200 support.
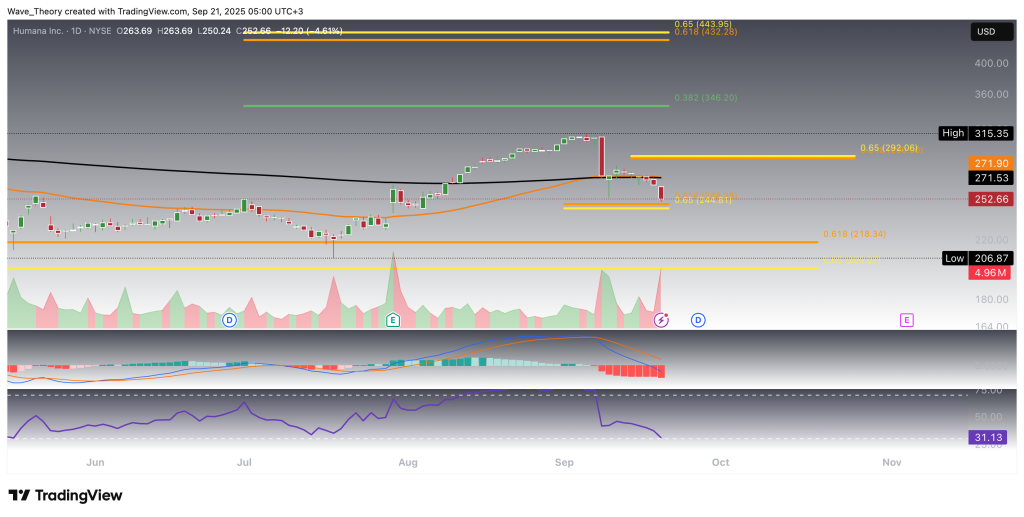
Daily Chart on the Verge of Confirming Death Cross
On the daily timeframe, momentum remains firmly to the downside. The MACD histogram continues to trend lower, while the MACD lines are already bearishly crossed, underscoring persistent selling pressure. Meanwhile, the EMAs are on the verge of establishing a death cross, which, once confirmed, would reinforce the bearish bias in the short- to medium term. In addition, the RSI is approaching oversold territory, yet it has not provided any bullish divergence or reversal signals, leaving downside risks intact for now.
Humana Inc. (NYSE: HUM) – Technical Summary
HUM has declined nearly 63% over the past three years and now trades around critical support levels. Immediate support sits at $245, with deeper downside risk to the $200 golden ratio support if it fails. On the upside, resistance levels to watch are $292, followed by $346, the 200-week EMA at $352, and the major Fibonacci barrier at $444. Momentum remains mixed: the MACD histogram trends lower, EMAs are near a death cross, yet the MACD lines remain bullishly crossed. The RSI stays neutral, approaching oversold without showing reversal signals.
- Check out our free forex signals
- Follow the top economic events on FX Leaders economic calendar
- Trade better, discover more Forex Trading Strategies
- Open a FREE Trading Account
- Read our latest reviews on: Avatrade, Exness, HFM and XM
ABOUT THE AUTHOR
See More
Konstantin Kaiser
Financial Writer and Market Analyst
Konstantin Kaiser comes from a data science background and has significant experience in quantitative trading. His interest in technology took a notable turn in 2013 when he discovered Bitcoin and was instantly intrigued by the potential of this disruptive technology.
Related Articles
Sidebar rates
