Amazon (AMZN) Approaches Rising Wedge Resistance — Momentum Fading?

Quick overview
- Amazon (AMZN) has surged over 40% in the past four months, breaking through a critical Fibonacci resistance level.
- The monthly chart shows strong bullish indicators, but signs of momentum fatigue are emerging on the weekly and daily charts.
- Currently, AMZN is testing upper resistance within a rising wedge pattern, which typically signals trend exhaustion.
- Key support levels to watch include the 50-day EMA at $211.96 and the 200-day EMA around $202.67, with potential downside targets if a correction occurs.
Amazon (AMZN) has staged a remarkable rally over the past four months, climbing more than 40% and decisively breaking through a critical Fibonacci golden ratio resistance level. This breakout marks a significant technical development in the broader bullish structure. The key question now: does this momentum signal further upside potential, or is a short-term pullback imminent?
Amazon Monthly Chart — Uptrend Intact, But Momentum Slowing
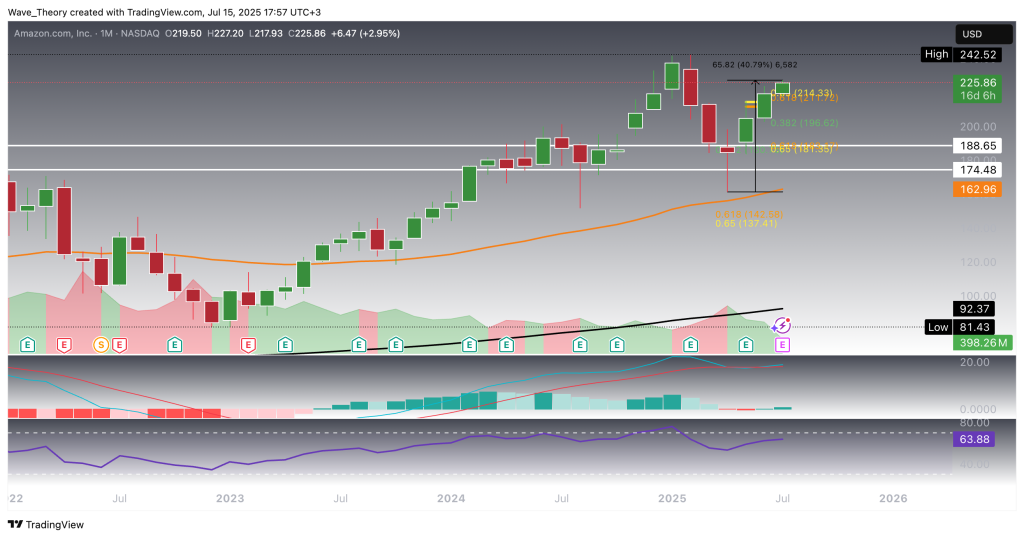
On the monthly chart, AMZN has demonstrated impressive strength, rebounding cleanly off the 50-month EMA support at $163 and rallying nearly 41% since. This surge culminated in a decisive breakout above the key Fibonacci golden ratio resistance at $214, opening the path toward a potential retest of the all-time high at $242.50. Momentum indicators align with this bullish narrative: the MACD lines have formed a bullish crossover, and the EMAs have remained a golden crossover—both strong confirmations of a long-term uptrend. Additionally, the MACD histogram is beginning to tick higher, while the RSI remains in neutral territory, offering further room for upside without immediate signs of exhaustion.
Weekly Chart — Further Upside of 7,5 %
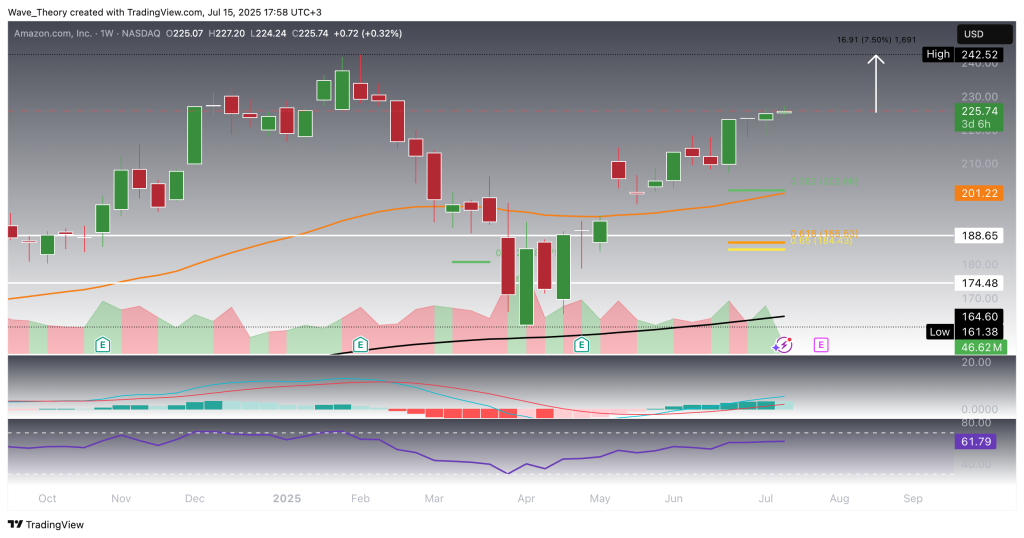
Zooming in to the weekly timeframe, AMZN has another ~7.5% of potential upside before encountering major resistance at its all-time high. The mid-term structure remains constructive: both the MACD lines and EMAs are bullishly aligned, reinforcing the ongoing uptrend. However, some early signs of momentum fatigue are emerging, as the MACD histogram begins to tick lower this week. Meanwhile, the RSI hovers in neutral territory, reflecting a temporary pause in directional conviction without signaling immediate reversal pressure.
Amazon Daily Chart Presents Mixed Signals
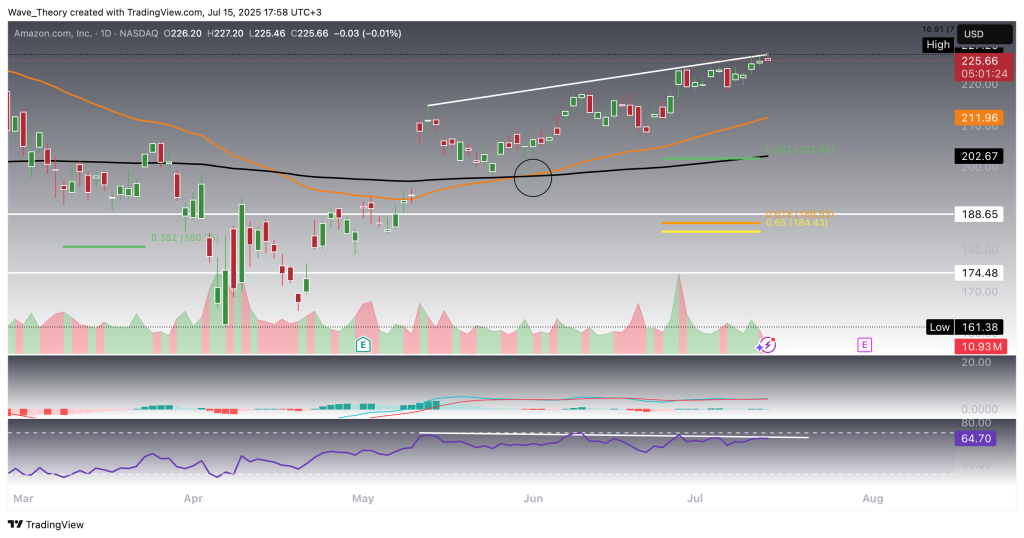
On the daily chart, AMZN is currently testing the upper resistance of a rising wedge — a pattern typically associated with trend exhaustion and increased risk of reversal. Adding to this cautionary setup is a pronounced bearish divergence between price and the RSI: while price action has pushed to higher highs, the RSI has failed to confirm, printing lower highs — a textbook signal of weakening bullish momentum.
Should a corrective phase unfold, key downside levels come into focus: the 50-day EMA at $211.96 and the 200-day EMA around $202.67 serve as initial support zones. A decisive break below the wedge would expose the Fibonacci retracement levels at $202 and $184 as potential downside targets.
Despite these near-term risks, the broader trend remains intact for now: the EMAs have confirmed a golden crossover, and the MACD lines remain bullishly aligned. That said, the MACD histogram is beginning to tick lower, suggesting a potential shift in short-term momentum.
Amazon Stock 4H Chart — Similar Outlook
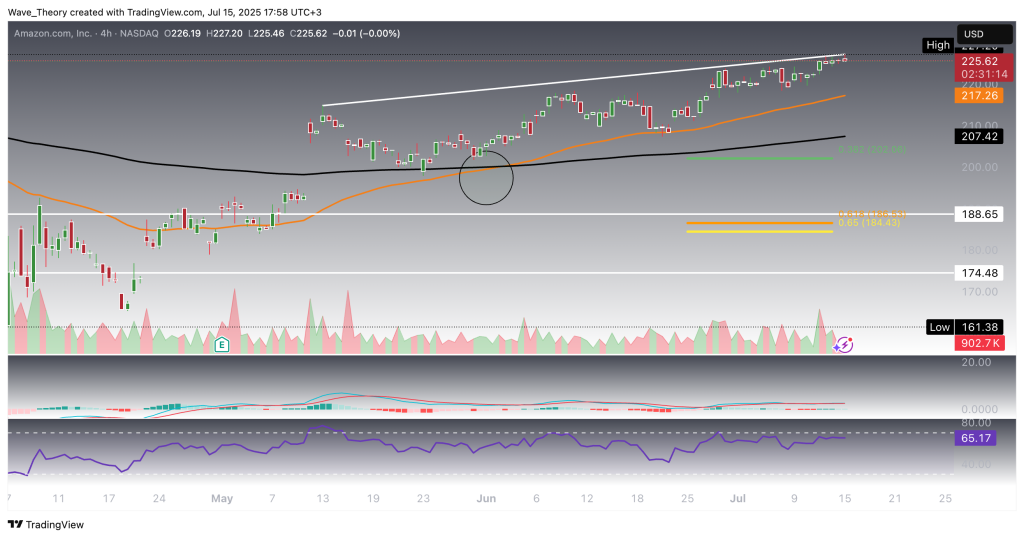
The 4H chart reflects a similar technical structure to the daily timeframe, with AMZN grinding higher along the upper boundary of a rising wedge — a pattern often signaling trend exhaustion. While price action remains technically bullish, momentum appears to be fading, as evidenced by a flattening MACD histogram.
That said, the short-term trend remains intact: the EMAs have confirmed a golden crossover, the MACD lines are bullishly aligned, and the RSI is hovering in neutral territory, offering no clear directional signal.
Should price break down from the wedge, initial support lies at the 50-EMA on the 4H chart near $217, followed by the 200-EMA at $207.40. A breach of this zone could trigger accelerated downside pressure, opening the door to a deeper retracement into the $188.65–$174.48 support range.
- Check out our free forex signals
- Follow the top economic events on FX Leaders economic calendar
- Trade better, discover more Forex Trading Strategies
- Open a FREE Trading Account
- Read our latest reviews on: Avatrade, Exness, HFM and XM
Related Articles


Sidebar rates
Related Posts
