Amazon (AMZN) Faces Critical Resistance — Breakout Ahead or Reversal Risk?

Quick overview
- Amazon (AMZN) stock has surged over 35% since early April, approaching a critical resistance level at $214.
- A breakout above this resistance could reignite bullish momentum, while failure to break through may lead to a bearish reversal.
- Short-term momentum indicators show emerging weakness, with MACD lines crossing bearishly and the histogram trending lower.
- If the stock fails to hold above key support levels, it may face deeper retracement towards $196.60 or $182.
Amazon (AMZN) stock has soared over 35% since early April, approaching a critical resistance zone that could define its next major move. Will the rally lose steam and trigger a reversal — or is a bullish breakout on the horizon?
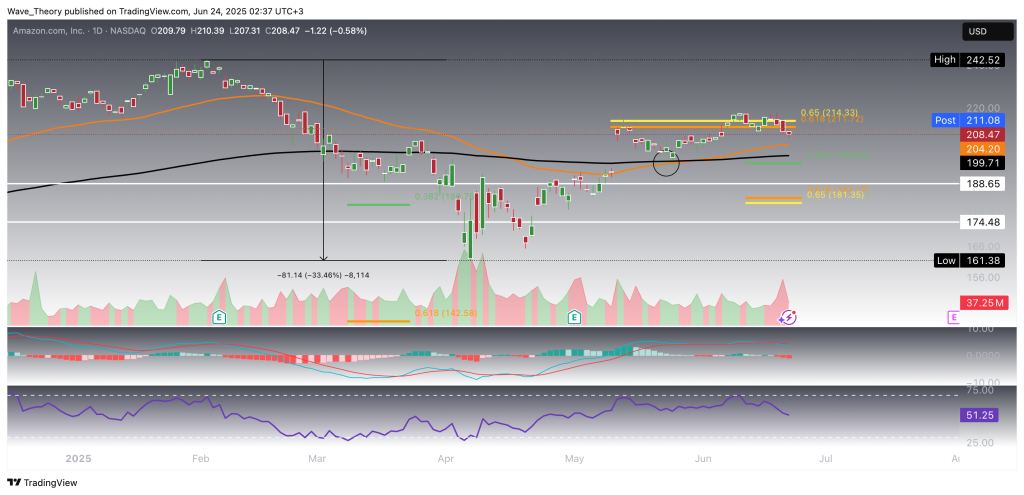
Amazon (AMZN) Faces Major Golden Ratio Resistance at $214
Since the beginning of April, Amazon (AMZN) has rallied impressively, gaining over 35% and establishing a golden crossover, confirming a bullish trend in the short- to medium-term. However, the stock now approaches a critical technical juncture at $214, which marks the golden ratio resistance level — a zone where AMZN was previously rejected.
A failure to decisively break through this resistance could trigger a bearish reversal, with immediate downside risk toward the next Fibonacci support level at $196.60. Should this level fail to hold, the golden ratio support at $182 would become the next key area to watch for potential stabilization.
From a momentum standpoint, the MACD currently reflects short-term bearish pressure, as the MACD lines have crossed bearishly and the histogram continues to trend lower. Meanwhile, the RSI remains in neutral territory, providing no clear directional bias at this stage.
In summary, AMZN is at a technically pivotal level. A confirmed breakout above $214 could reaccelerate bullish momentum, while rejection could usher in a corrective phase toward deeper Fibonacci support levels.
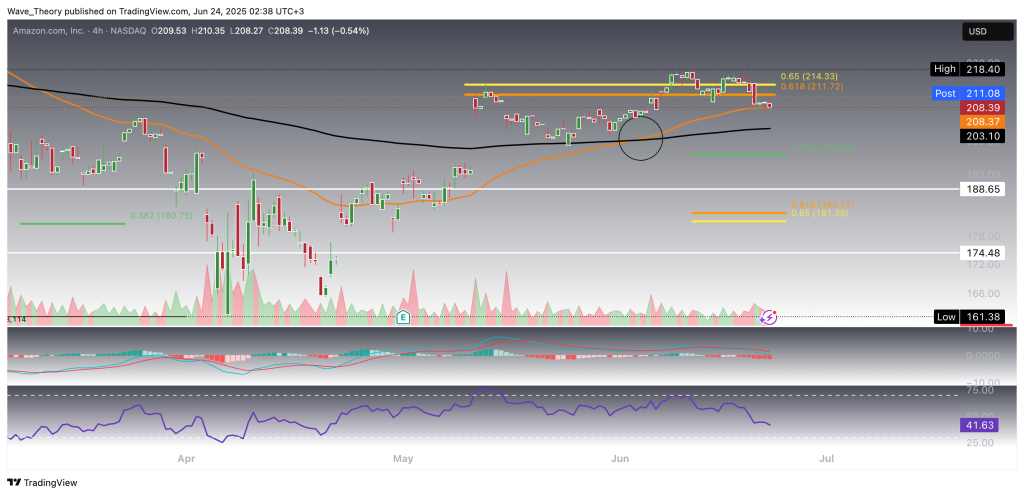
Similar Outlook on the 4H Chart
The 4-hour chart reflects a near-identical technical setup. The EMAs have formed a golden crossover, reinforcing a bullish short-term trend. However, momentum indicators suggest emerging weakness: the MACD lines have crossed bearishly, and the MACD histogram continues its downward trajectory, indicating persistent short-term bearish momentum. Meanwhile, the RSI hovers in neutral territory, offering no clear directional bias.
At present, AMZN is holding above support at the 50-4H-EMA at $208.40. A break below this level could open the door for a deeper retracement toward the 200-4H-EMA at $203, slightly above the next Fibonacci support zone.
In summary, while the broader trend remains constructive, short-term momentum is weakening. Price action around the $208.40 and $203 levels will be critical in determining whether Amazon resumes its rally or enters a deeper consolidation phase.
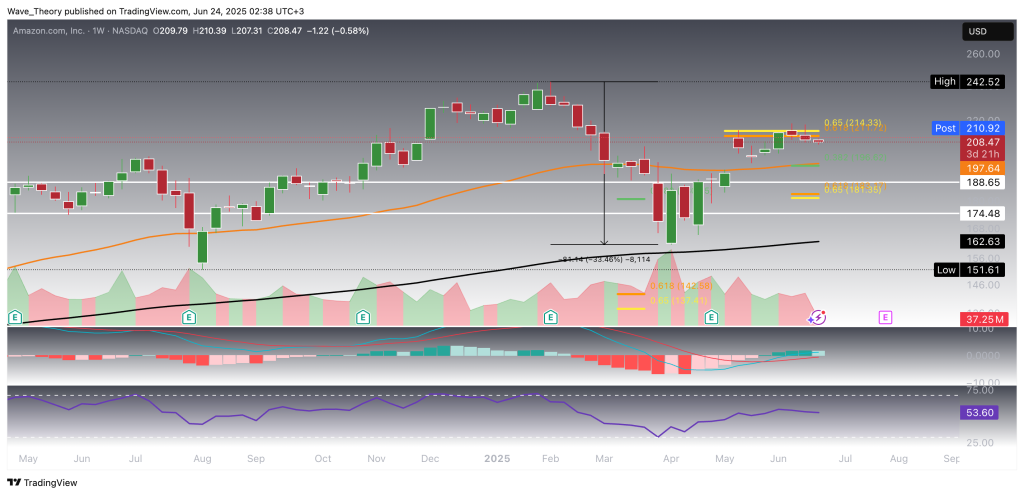
Amazon (AMZN) Stock Dropped 33.5% Prior to Current Rally — Now Approaches Make-or-Break Resistance
Before Amazon’s recent surge, the stock endured a 33.5% decline, ultimately finding solid support at the 200-week EMA, which currently sits at $163. This level served as a critical long-term anchor, preventing further downside and setting the stage for the current rebound.
Despite the correction, the weekly EMAs and MACD lines remained in a bullish crossover, maintaining a constructive mid-term trend outlook. However, the RSI continues to oscillate in neutral territory, offering little directional clarity at this stage.
Now, AMZN finds itself at a technically pivotal level. The golden ratio resistance at $214 has once again come into play — a zone that must be broken decisively to invalidate the ongoing correction phase. A successful breakout above this level would likely reignite bullish momentum, positioning Amazon to retest its all-time high at $242.50.
For now, however, price action signals potential rejection at this resistance. The MACD histogram has begun to tick lower on the weekly chart, suggesting that bearish momentum may be building.
Should a correction unfold, the 50-week EMA at $197.60, which aligns with the 0.382 Fibonacci retracement level, serves as the next significant support. A bounce from this zone could offer a renewed attempt to challenge the $214 barrier.
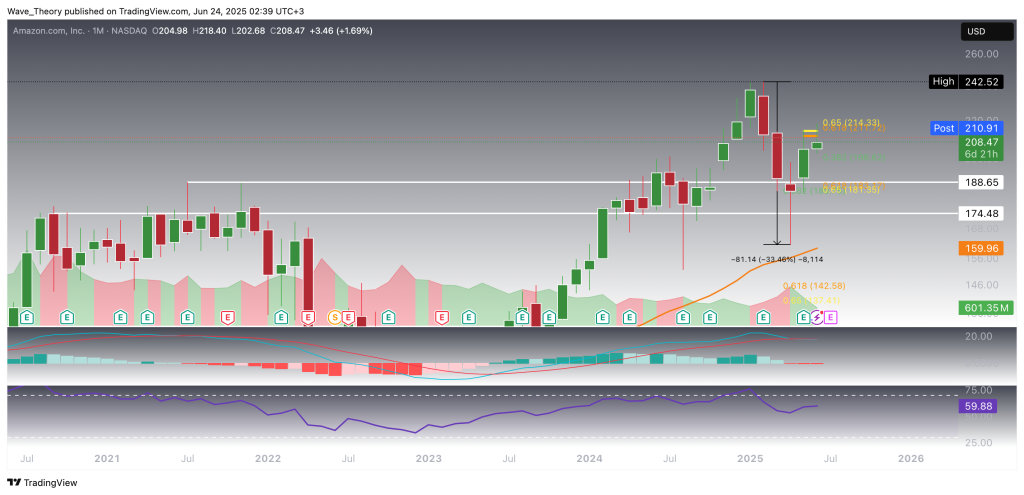
Amazon (AMZN) Shows Bearish Momentum on the Monthly Chart
The monthly chart of Amazon (AMZN) presents a cautiously bearish technical outlook. The MACD lines remain bearishly crossed, and the MACD histogram has been ticking lower for consecutive months, indicating persistent downward momentum. At the same time, the RSI continues to fluctuate within neutral territory, providing no strong directional signal.
Technically, Amazon remains under pressure unless it can achieve a decisive breakout above the golden ratio resistance at $214. In the event of continued rejection, AMZN finds strong support between $174.50 and $188.65 — a critical zone that previously acted as both resistance and support.
Should this range fail to hold, the next significant downside target lies at the 50-month EMA, currently positioned at $156, which could serve as a final line of defense for the long-term bullish structure.
- Check out our free forex signals
- Follow the top economic events on FX Leaders economic calendar
- Trade better, discover more Forex Trading Strategies
- Open a FREE Trading Account
- Read our latest reviews on: Avatrade, Exness, HFM and XM
Related Articles


Sidebar rates
Related Posts
