WTI Crude Price Forecast: Can Triangle Support Save Oil Price Levels Near $91?
U.S. WTI crude oil (USOIL) is currently experiencing a significant technical convergence while the global economy prepares for monetary...
Quick overview
- U.S. WTI crude oil is currently trading at $91.41, showing a slight increase while testing a crucial support trend line.
- The ongoing U.S.-Iran truce has led to increased crude throughput, reducing immediate war risks affecting oil prices.
- The upcoming OPEC+ meeting on June 7 is anticipated to confirm a production increase, impacting market dynamics.
- Technical analysis indicates a potential breakout for USOIL, with key resistance levels at $96.00 and $98.62.
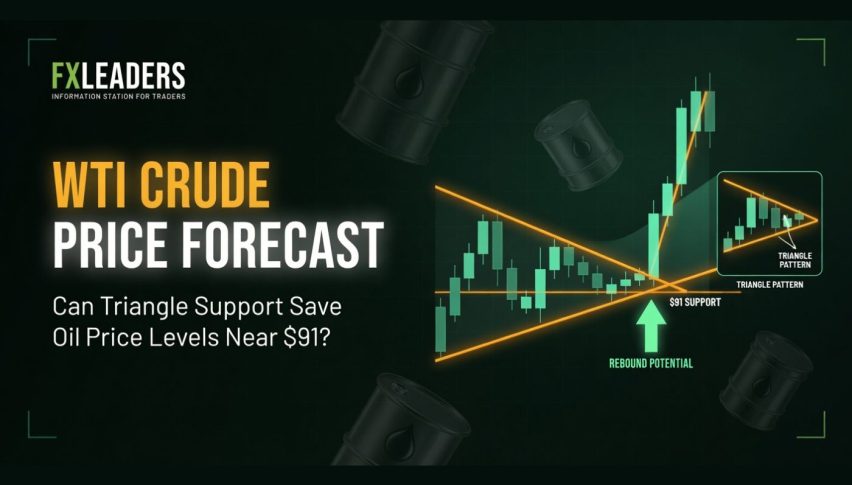
U.S. WTI crude oil (USOIL) is currently experiencing a significant technical convergence while the global economy prepares for monetary easing. USOIL price is trading at $91.41, with a modest 0.48% uptick recorded on the daily. The USOIL price is under extreme compression and is testing a lower trend line of a huge symmetrical triangle pattern from the USOIL 4H chart, as the geopolitical heat decreases. It will have to be weighed with the impending rate of change in monetary policy from major oil producers.
Main Drivers of The Day
- The Seven-Week U.S.-Iran Truce Continues Crude throughput through the Strait of Hormuz has increased to 75 to 80% of the peak prior to the crisis, which is slowly draining the price of immediate war risks. This is however constrained as repairs are ongoing.
- Upcoming OPEC+ Meeting The oil markets now focus on the OPEC+ ministers meeting on June 7. As the UAE exits OPEC, a 188,000-barrel-per-day increase in production in July, which is expected to be confirmed by seven core members of the organization.
- New Federal Reserve Chair Sworn In With the U.S. April inflation coming in at a scorching 3.8% year-over-year, the expectations for 2026 interest rate cuts have completely dissolved as a new Fed chairperson Kevin Warsh was sworn in.
WTI Crude Oil Price Technical Analysis
The USOIL price is in range formation, as displayed on the USOIL 4H chart. The USOIL is being rejected off its upper counter trend line and is now bouncing off of its lower trend line (the green one) at $91.41 in a crucial test of support.
The past several USOIL price sessions have been bearish as prices were hammered to the $90.09 to $91.41 horizontal demand zone. The 14-period relative strength index is in oversold condition between 31.97 and 39.33, as indicated by a positive divergence. This is a very oversold condition that suggests a breakout is imminent.

Resistance:
- The next key resistance level is $96.00.
- Other resistance level is $98.62 (red trendline).
- The major structural resistance is $112.00.
Support:
- The first immediate support level is $91.41 (green trendline).
- The second immediate support level is the $90.09 (horizontal support).
- The final support level is $85.81.
USOIL Trade Idea
There may be a breakout trade forming in the USOIL.
Entry: Buy stop as long as the USOIL closes above $96.00. Exit: $98.62 (Target 1), $104.50 (Target 2). Stop Loss: Placed strictly beneath the key structural support floor at $90.09.
Conclusion
WTI crude oil is likely in a post-geopolitical event consolidation, testing multiple trend lines in a key pattern. Non-OPEC U.S. and Guyana supply has increased significantly. However, deep decadal under investments in oil prevent the market from collapsing. As we wait for the crucial EIA Oil Stock report on next week, we will be in a high compression pattern. Trade the USOIL using the clear triangle structure ahead of the likely OPEC+ supply rate decision in June.
- Check out our free forex signals
- Follow the top economic events on FX Leaders economic calendar
- Trade better, discover more Forex Trading Strategies
- Open a FREE Trading Account
- Read our latest reviews on: Avatrade, Exness, HFM and XM

Related Articles
Sidebar rates

Related Posts
 Save
SaveAva

