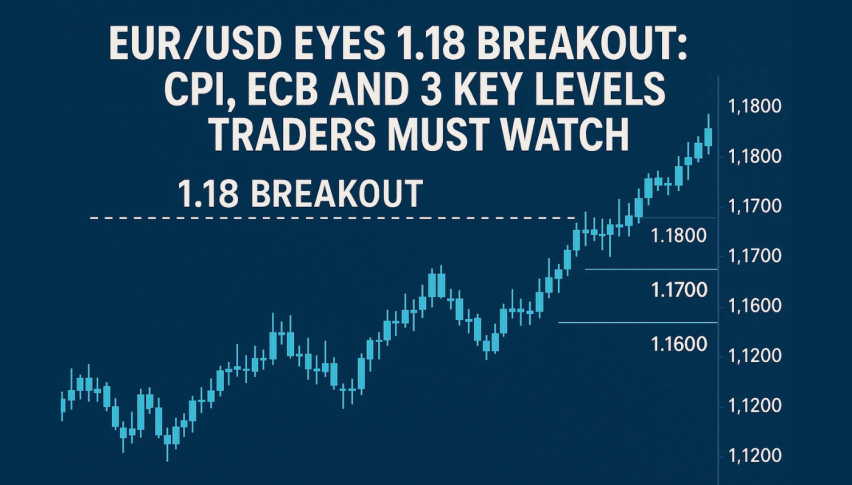
EUR/USD Eyes 1.18 Breakout: CPI, ECB and 3 Key Levels Traders Must Watch
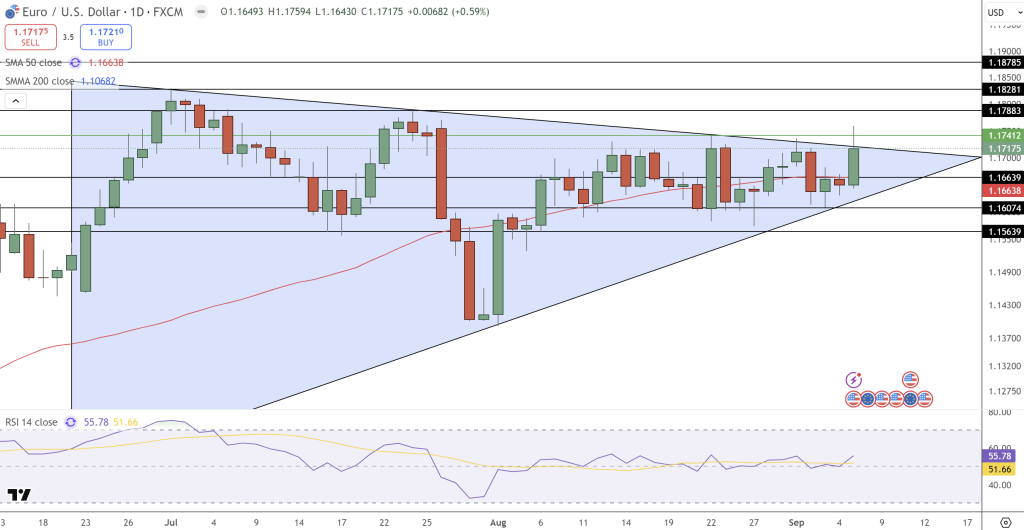
The euro-dollar is stuck in a symmetrical triangle, trading at 1.1717 as bulls and bears fight for control. Price action has been...
Quick overview
- The euro-dollar is currently trading at 1.1717, caught in a symmetrical triangle as market participants vie for control.
- Key technical levels include a short-term floor at the 50-day SMA of 1.1663 and a potential breakout zone between 1.1741 and 1.1788.
- Upcoming economic data, including U.S. inflation reports and the ECB meeting, could significantly influence the EUR/USD direction.
- Traders are advised to consider bullish positions above 1.1741 and bearish setups at resistance levels, particularly 1.1607.
The euro-dollar is stuck in a symmetrical triangle, trading at 1.1717 as bulls and bears fight for control. Price action has been tightening between higher lows and lower highs, a setup that often ends in a big move. The 50-day SMA at 1.1663 is now the short-term floor, while the 200-day SMA at 1.1068 is the deep safety net.
Candles have been mixed, with dojis and spinning tops showing indecision. But the latest green close near resistance suggests momentum may be shifting up. On the RSI, a reading of 55.8 is mild bullish without being overbought, leaving room to go higher.
Key Events This Week
A big week ahead with data and central bank signals that will shape EUR/USD’s next move.
- Sept. 10 – U.S. PPI: 0.3% expected, a test for inflation momentum.
- Sept. 11 – ECB Meeting: Rates expected to be on hold at 2.15%, but Lagarde’s press conference could change sentiment.
- Sept. 11 – U.S. CPI: 0.3% monthly / 2.9% yearly, a key for the Fed’s rate path.
- Sept. 12 – U.S. Sentiment: 58.0 expected, a read on consumer resilience.
A dovish ECB and hot U.S. inflation could drag EUR/USD down, while steady eurozone and cooling U.S. data could trigger a breakout above 1.1741 to 1.1828.
EUR/USD Technical Outlook and Trade
Technically, 1.1741-1.1788 is the first test for the bulls. A daily close above this zone would confirm the triangle breakout, 1.1828 next. Failure to clear resistance could bring sellers back in, 1.1663 and then 1.1607.
For new traders, the setup is simple:
- Bullish: Enter long above 1.1741, target 1.1788-1.1828, stop below 1.1660.
- Bear: Look for bearish engulfing or three black crows at resistance; short at 1.1607.
The takeaway: EUR/USD sits at a technical crossroads, and this week’s data could be the catalyst for the next major move.
- Check out our free forex signals
- Follow the top economic events on FX Leaders economic calendar
- Trade better, discover more Forex Trading Strategies
- Open a FREE Trading Account
- Read our latest reviews on: Avatrade, Exness, HFM and XM
Related Articles


Sidebar rates
Related Posts
