Prices Forecast: Technical Analysis
For the daily forecast, Ankr is expected to close around $0.0155, with a potential range between $0.0150 and $0.0160. The weekly forecast suggests a closing price of approximately $0.0160, with a range from $0.0150 to $0.0170. The RSI is currently at 35.8316, indicating a bearish trend, as it is below the neutral 50 mark. The ATR at 0.0008 suggests moderate volatility, which could lead to price fluctuations within the predicted range. The MACD line is negative, reinforcing the bearish sentiment. However, the ADX at 21.5403 shows a weak trend, suggesting that the current bearish momentum might not be strong enough to push prices significantly lower. The economic calendar indicates a potential slowdown in China’s retail sales and industrial production, which could indirectly affect Ankr’s price due to its ties with broader market sentiment.
Fundamental Overview and Analysis
Ankr’s recent price trend has been downward, with the last closing price at $0.0153. This decline is partly due to broader market conditions and specific economic indicators pointing to a slowdown in key markets like China. The asset’s value is influenced by supply and demand dynamics, technological advancements in blockchain, and regulatory changes. Investor sentiment appears cautious, with a focus on potential risks such as market volatility and competition from other blockchain platforms. Despite these challenges, Ankr has opportunities for growth through scalability and expansion into new markets. Currently, Ankr seems undervalued given its technological potential, but market conditions and sentiment are keeping prices suppressed.
Outlook for Ankr
The future outlook for Ankr includes potential recovery as market conditions stabilize. Historical price movements show a pattern of volatility, with significant swings influenced by macroeconomic factors. In the short term (1 to 6 months), Ankr’s price could see modest gains if economic conditions improve and investor sentiment turns positive. Long-term forecasts (1 to 5 years) suggest potential growth driven by technological advancements and increased adoption of blockchain solutions. However, external factors such as geopolitical tensions or market crashes could impact prices. Overall, while the current sentiment is bearish, the long-term outlook remains cautiously optimistic, contingent on broader market recovery and technological progress.
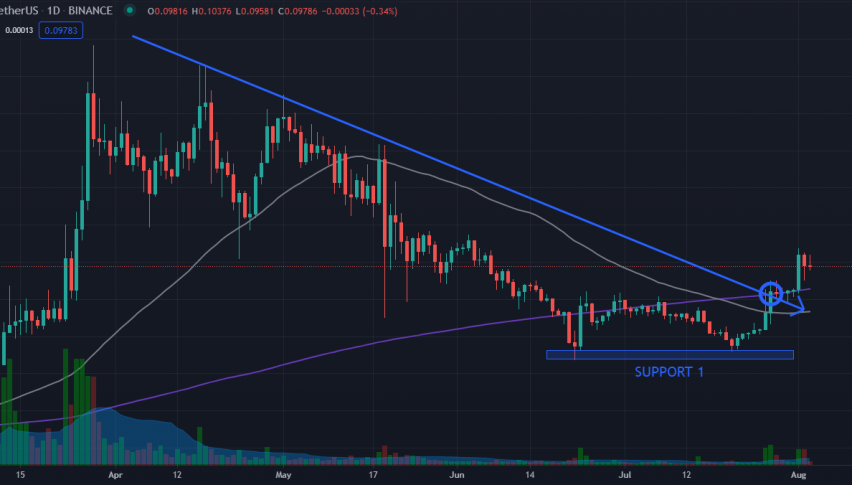
Technical Analysis
Current Price Overview: The current price of Ankr is $0.0153, slightly down from the previous close of $0.0154. Over the last 24 hours, the price has shown a downward trend with moderate volatility, as indicated by the ATR. Support and Resistance Levels: Key support levels are at $0.0150, $0.0145, and $0.0140, while resistance levels are at $0.0160, $0.0165, and $0.0170. The pivot point is at $0.02, and Ankr is trading below it, suggesting bearish sentiment. Technical Indicators Analysis: The RSI at 35.8316 indicates a bearish trend. The ATR of 0.0008 suggests moderate volatility. The ADX at 21.5403 shows a weak trend, indicating that the current bearish momentum may not be strong. The 50-day SMA is below the 200-day EMA, reinforcing the bearish outlook. Market Sentiment & Outlook: Sentiment is currently bearish, as Ankr is trading below the pivot, with RSI and ADX indicating weak bearish momentum. The moving average crossover supports this view, while ATR suggests potential for price fluctuations.
Forecasting Returns: $1,000 Across Market Conditions
The table below outlines potential returns on a $1,000 investment in Ankr under different market scenarios. In a Bullish Breakout scenario, a 10% price increase could raise the investment to approximately $1,100. In a Sideways Range scenario, with a 0% change, the investment remains at $1,000. In a Bearish Dip scenario, a 10% decrease could reduce the investment to about $900. These scenarios highlight the importance of market conditions on investment outcomes. Investors should consider their risk tolerance and market outlook when deciding to invest in Ankr. Practical steps include monitoring market trends, setting stop-loss orders, and diversifying investments to mitigate risks.
| Scenario | Price Change | Value After 1 Month |
|---|---|---|
| Bullish Breakout | +10% to ~$0.0168 | ~$1,100 |
| Sideways Range | 0% to ~$0.0153 | ~$1,000 |
| Bearish Dip | -10% to ~$0.0138 | ~$900 |
FAQs
What are the predicted price forecasts for the asset?
The daily forecast for Ankr suggests a closing price around $0.0155, with a range between $0.0150 and $0.0160. The weekly forecast anticipates a closing price of approximately $0.0160, with a range from $0.0150 to $0.0170.
What are the key support and resistance levels for the asset?
Key support levels for Ankr are at $0.0150, $0.0145, and $0.0140. Resistance levels are identified at $0.0160, $0.0165, and $0.0170. The pivot point is at $0.02, and Ankr is currently trading below it.
Disclaimer
In conclusion, while the analysis provides a structured outlook on the asset’s potential price movements, it is essential to remember that financial markets are inherently unpredictable. Conducting thorough research and staying informed about market trends and economic indicators is crucial for making informed investment decisions.