Prices Forecast: Technical Analysis
For the USD/TRY, the daily closing price is predicted to be around 39.85 TRY, with a range between 39.70 TRY and 40.00 TRY. The weekly closing price is expected to be approximately 39.90 TRY, with a range from 39.60 TRY to 40.20 TRY. The RSI is currently at 71.9395, indicating a bullish trend, as it is above the 70 mark. The ATR at 0.1664 suggests moderate volatility, while the ADX at 17.8515 indicates a weak trend strength. The MACD line is above the signal line, reinforcing the bullish sentiment. The pivot point at 39.82 TRY is crucial, with the asset trading slightly above it, suggesting potential upward movement. The technical indicators collectively point towards a bullish outlook, but traders should be cautious of potential resistance near the upper range.
Fundamental Overview and Analysis
Recently, USD/TRY has shown a steady upward trend, driven by macroeconomic factors such as the US labor market data and Turkey’s economic conditions. The US Non-Farm Payrolls and unemployment figures suggest a stable US economy, supporting the USD. Meanwhile, Turkey faces challenges with inflation and economic stability, influencing the TRY’s depreciation. Investor sentiment remains cautious, with concerns over Turkey’s economic policies and geopolitical tensions. Opportunities for USD/TRY growth lie in the US’s economic resilience and Turkey’s potential policy reforms. However, risks include Turkey’s inflationary pressures and potential US interest rate hikes. Currently, the asset appears fairly priced, with room for growth if Turkey stabilizes its economy.
Outlook for USD/TRY
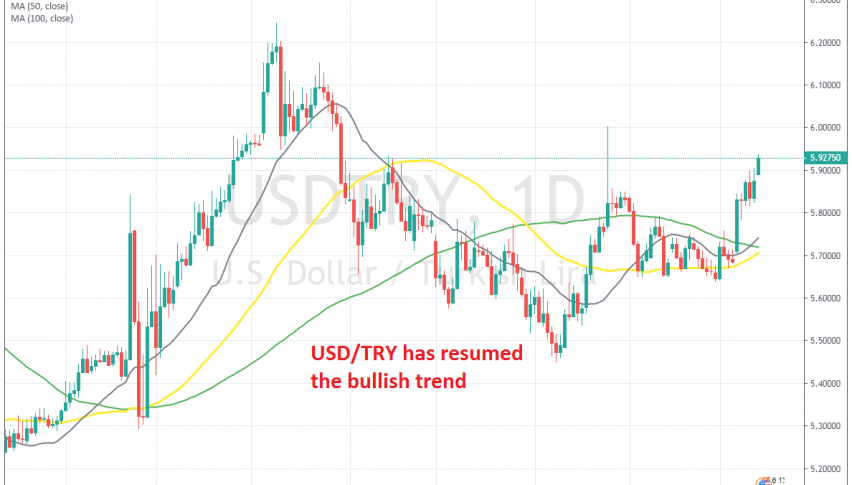
The future outlook for USD/TRY suggests continued upward pressure, influenced by the US’s strong economic indicators and Turkey’s ongoing economic challenges. Historical price movements show a consistent upward trend, with volatility driven by macroeconomic events. Key factors likely to influence the price include US economic data, Turkey’s inflation rates, and geopolitical developments. In the short term (1 to 6 months), USD/TRY is expected to remain bullish, potentially reaching new highs if current trends persist. Long-term forecasts (1 to 5 years) depend on Turkey’s economic reforms and global economic conditions. External factors such as geopolitical tensions or significant policy changes could impact the asset’s price significantly.
Technical Analysis
Current Price Overview: The current price of USD/TRY is 39.8175 TRY, slightly below the previous close of 39.8388 TRY. Over the last 24 hours, the price has shown a slight downward correction with moderate volatility.
Support and Resistance Levels: Key support levels are at 39.71, 39.61, and 39.50 TRY, while resistance levels are at 39.92, 40.02, and 40.13 TRY. The pivot point is at 39.82 TRY, with the asset trading just below it, indicating potential resistance.
Technical Indicators Analysis: The RSI at 71.9395 suggests a bullish trend. The ATR of 0.1664 indicates moderate volatility. The ADX at 17.8515 shows weak trend strength. The 50-day SMA and 200-day EMA do not show a crossover, indicating no significant trend reversal.
Market Sentiment & Outlook: Sentiment is currently bullish, supported by the RSI and price action near the pivot. However, the weak ADX suggests caution, as the trend may not be strong enough to sustain a significant breakout.
Forecasting Returns: $1,000 Across Market Conditions
The table below outlines potential returns on a $1,000 investment in USD/TRY under different market scenarios. In a Bullish Breakout scenario, a 5% price increase could result in an estimated value of $1,050. In a Sideways Range scenario, with a 1% price change, the investment might be worth $1,010. In a Bearish Dip scenario, a 3% decrease could reduce the investment to $970. These scenarios highlight the importance of market conditions on investment outcomes. Investors should consider their risk tolerance and market outlook when deciding to invest in USD/TRY. Diversification and monitoring of economic indicators are recommended for managing potential risks.
| Scenario | Price Change | Value After 1 Month |
|---|---|---|
| Bullish Breakout | +5% to ~$41.80 | ~$1,050 |
| Sideways Range | +1% to ~$40.20 | ~$1,010 |
| Bearish Dip | -3% to ~$38.60 | ~$970 |
FAQs
What are the predicted price forecasts for the asset?
The daily closing price for USD/TRY is predicted to be around 39.85 TRY, with a range between 39.70 TRY and 40.00 TRY. The weekly closing price is expected to be approximately 39.90 TRY, with a range from 39.60 TRY to 40.20 TRY.
What are the key support and resistance levels for the asset?
Key support levels for USD/TRY are at 39.71, 39.61, and 39.50 TRY. Resistance levels are at 39.92, 40.02, and 40.13 TRY. The pivot point is at 39.82 TRY, with the asset trading just below it, indicating potential resistance.
What are the main factors influencing the asset’s price?
USD/TRY’s price is influenced by US economic indicators, Turkey’s inflation rates, and geopolitical developments. The US’s strong economic data supports the USD, while Turkey’s economic challenges and inflationary pressures impact the TRY.
What is the outlook for the asset in the next 1 to 6 months?
In the short term (1 to 6 months), USD/TRY is expected to remain bullish, potentially reaching new highs if current trends persist. The outlook is supported by the US’s economic resilience and Turkey’s ongoing economic challenges.
Disclaimer
In conclusion, while the analysis provides a structured outlook on the asset’s potential price movements, it is essential to remember that financial markets are inherently unpredictable. Conducting thorough research and staying informed about market trends and economic indicators is crucial for making informed investment decisions.