Yesterday we presented you guys with buy and sell orders in GBP/USD and EUR/USD, or as we like to call them support and resistance numbers. Today we will take a look at these levels in USD/JPY and AUD/USD. Then, we can use these levels for entry and exit points after intraday trends have been established in major forex pairs.
USD/JPY – This pair has made several attempts to break below the 100 support level but after failing for the hundredth time last week, the price reversed and it´s been a one-way traffic this week. The 20 simple moving average (SMA) in the H1 forex chart has been providing solid support all week so that´s the first support level, which at the moment stands at 103.50.
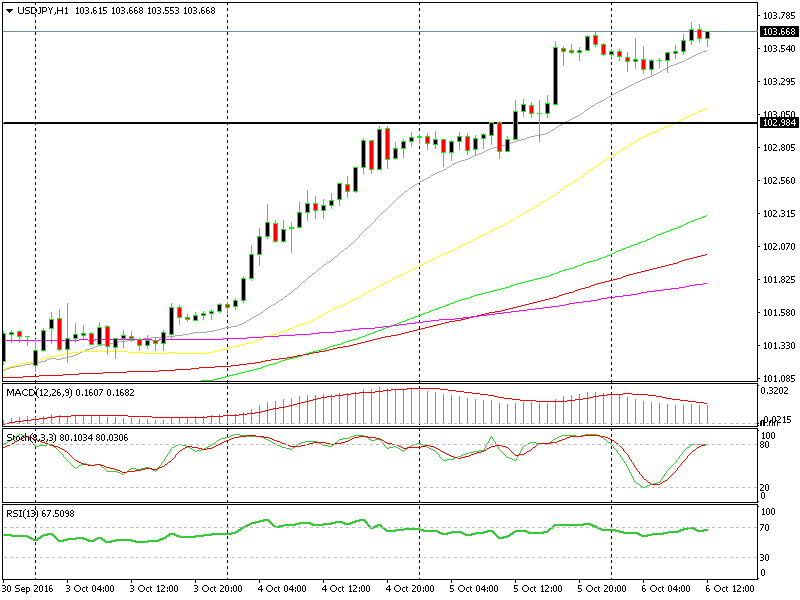 The 20 moving average is doing a damn good job pushing USD/JPY higher
If the price manages to break below it which would be the first time this week, then today´s low at 103.30 will be the next support level. The 50 SMA in yellow awaits at 103.10 but if the price doesn´t move down in the next few hours then the SMA will have reached the 103.30 level which will add extra strength to this support level. Below there comes 103 of course which has been resistance before, 102.60-70 and 101.80.
The first resistance level comes at 103.70; that´s where we are right now and that´s where the 100 SMA stands on the daily forex chart. That is followed by September´s high at 104.30s, 105 and obviously 105.50.
AUD/USD – This pair has been in an uptrend during most of September, but after last week´s consolidation the price has declined all of this week, so I think it´s best to look at the resistance levels first. We can use these levels as entry points for sell orders in this pair during the pullbacks.
0.7590 – 0.76 has been the low in the last two days, which makes it the first resistance level after being broken today. That´s followed by the 200 smooth MA in the hourly chart as well as the daily chart at 0.7620. Above there comes yesterday´s high at 0.7645-50 and then this week´s high at 0.7690 – 0.77.
The first buy order/support level is provided by the 200 smooth MA at 0.7570 which has been the low today so far. The 100 smooth and simple moving averages on the daily chart stand at 0.7500 – 0.7510 so that´s the second support level. September´s low at 0.7440 will be the ultimate support level.