That Chart Setup in USD/JPY We mentioned Yesterday Is Working Out
Do you remember the forex update about USD/JPY that we posted yesterday? We highlighted a setup on the daily USD/JPY chart.
Do you remember the forex update about USD/JPY that we posted yesterday? We highlighted a setup on the daily USD/JPY chart. It looked bearish and today we see that the price is following in its footsteps.
A straightforward bearish setup; a doji followed by a big red candlestick
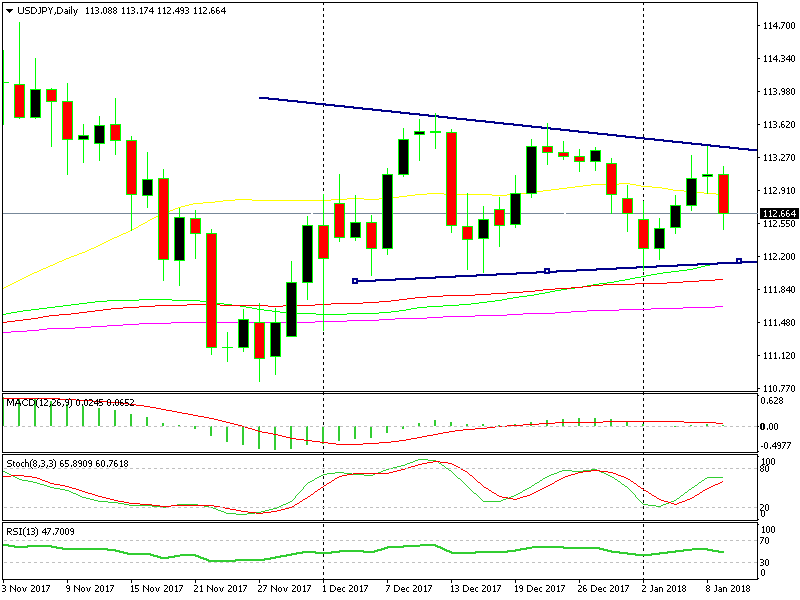
When we posted that update yesterday, the daily candlestick was looking like an upside down hammer, which is a reversing signal. The price failed at the ascending trend line of the wedge. Besides that, the stochastic indicator was almost overbought. So, it seemed like this pair was turning bearish after trending higher for a few days.
The daily candlestick didn’t close as a hammer, but it did form a doji, which is a reversing signal as well.
Although, I spotted a different setup on the hourly timeframe. It pointed up and we went long with a short term forex signal. Well, the signal hit stop loss (SL) this morning, but at some point last night we were just a few pips away from take profit (TP).
The turnaround happened after midnight and this forex pair lost about 60 pips. The economic data from Japan was very light last night, so the decline didn’t come from the fundamentals.
The only reason for that turnaround remains the technical setup. The picture now is still bearish and the target for sellers is the lower line of the wedge. It comes at the same level as the 100 SMA (green) at 112. So, if the sellers manage to push down there, I would look to buy, since it is a strong level.
- Check out our free forex signals
- Follow the top economic events on FX Leaders economic calendar
- Trade better, discover more Forex Trading Strategies
- Open a FREE Trading Account
- Read our latest reviews on: Avatrade, Exness, HFM and XM
Related Articles


Sidebar rates
Related Posts
