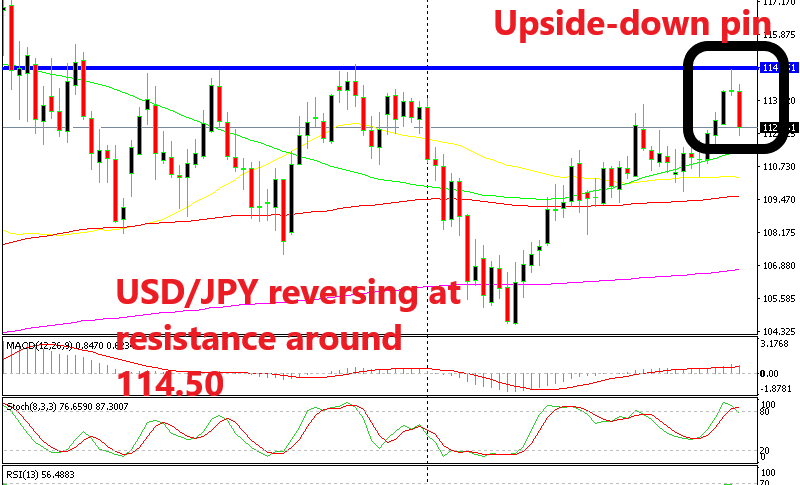
USD/JPY Remains Bearish After Reversing at Resistance on Weekly Chart
fundamentals have turned bearish for USD/JPY. Although, the reverse of the last few days might be technical and it might go on for some time
The fundamentals have turned hawkish for the JPY in the short term, which means that USD/JPY has turned bearish and will likely remain like that for the next couple of weeks. The reason for this is the negative market sentiment which has been hurt by the Italian budget “crisis” and the failure to reach a Brexit deal, both of which will be under the spotlight during next week’s EU summit, which will be the last one officially for 2018. So, I expect USD/JPY to remain bearish until the end of next week at least.
That is why we have turned bearish on this forex pair as yesterday’s sell signal showed. But, I hadn’t seen the larger USD/JPY charts. Now that I see the weekly chart, I think that this reverse came at the right place and the right time technically. I have mentioned many times before that you would be surprised how often technicals and fundamentals coincide together.
This is one of those cases. As you can see from the weekly chart above, USD/JPY reversed right at resistance. The price has formed a strong resistance level at around 114.50s; that has been the highest level since January last year.
The chart setup was perfect for a reversal; last week’s candlestick closed as an upside-down pin which is a reversing signal. The stochastic indicator was severely overbought and it is now turning lower. This week’s candlestick is already pretty bearish, so it goes in line with the bearish reversing setup.
 ort The 20 SMA has shifted from support to resistance
 ort The 20 SMA has shifted from support to resistance
Switching to the H4 chart, we see that the 20 SMA (grey) has now turned into resistance for USD/JPY after it got broken. It worked as support on the way up, so it makes sense that it turns into resistance now. So, I will wait for a small retrace up to the 100 SMA (red) and by that time, the 20 SMA will have caught up with the price and the next bearish wave will resume. It only needs to retrace 30 pips higher, so let’s wait.
- Check out our free forex signals
- Follow the top economic events on FX Leaders economic calendar
- Trade better, discover more Forex Trading Strategies
- Open a FREE Trading Account
- Read our latest reviews on: Avatrade, Exness, HFM and XM
Related Articles


Sidebar rates
Related Posts
