Bitcoin Slips Below One SMA, but Finds Support at Another SMA
Bitcoin has found solid resistance around $4,000 and has tried to reverse down, but the 20 SMA is holding the dips on the H4 chart right now
Yesterday I posted an update in BITCOIN highlighting the break of the 50 SMA (yellow) on the H1 time-frame. This moving average caught up with the price on the H1 chart and was providing support to dips in the previous couple of days, but it got broken yesterday, which opened the door to a bearish reversal for Bitcoin.
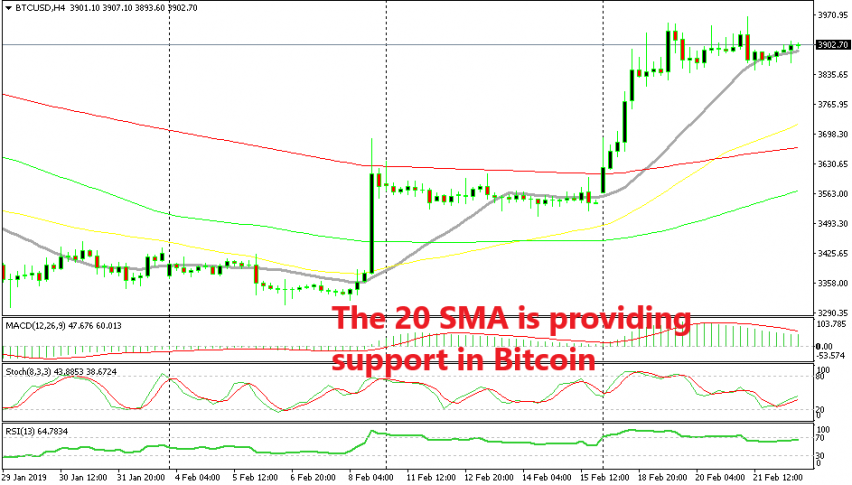
But, another moving average has caught up with the price, this time on the H4 time-frame. As you can see from the Bitcoin chart above, the 20 SMA (grey) has been providing some weak support and resistance to Bitcoin before. This moving average reached the price yesterday and it has held the dips since then.
We have seen the price pierce the 20 SMA to the downside several times in the last few trading sessions but it has reversed back above it pretty quickly. These piercings don’t count as a break until an H4 candlestick clearly closes below it. A close below the 20 SMA would be considered a break and it would open the door to the next moving average which is the 100 SMA (red) at $3,600.
That is another support and resistance zone which would be another level where Bitcoin has second thoughts. After that comes the $3,200 level, but before we make plans too far ahead, we should wait until the 20 SMA gets broken on this chart.
We are already short on Bitcoin, so we can’t do anything but wait for the break. For those who are not in a trade, this looks like a really good opportunity to go short on Bitcoin around here since the area around $4,000-$4,200 is a major resistance area.
- Check out our free forex signals
- Follow the top economic events on FX Leaders economic calendar
- Trade better, discover more Forex Trading Strategies
- Open a FREE Trading Account
- Read our latest reviews on: Avatrade, Exness, HFM and XM
Related Articles


Sidebar rates
Related Posts
