Bitcoin Weekly Analysis – Ascending Triangle in Limelight


Just like the forex market, BTC/USD is also experiencing a light trading volume. Bitcoin is trading at a slow pace after its sharp climb earlier this month, moving firmly inside a newly-formed ascending triangle pattern.
Right now, Bitcoin is trading below a solid resistance area of $5,365. If this resistance level remains intact, Bitcoin could retreat back to the channel support at around $5,100.
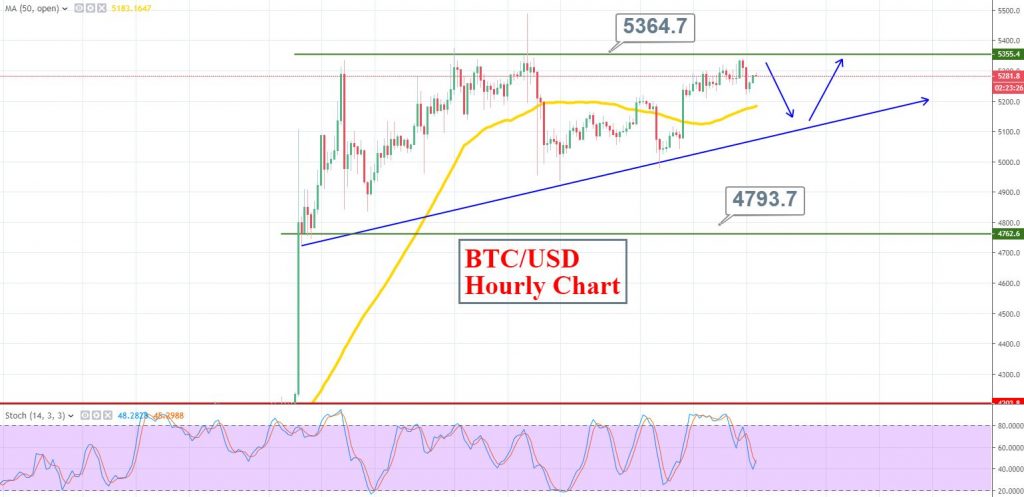
BTC/USD – 3 Hour Chart
A break above the $5,365 area, on the other hand, could take the price to the very top of the channel at $5,500-$5,600.
The 50 periods EMA is suggesting a bullish bias, and the RSI is in the middle of nowhere. It means, the RSI will be okay with whichever direction investors decide to move in.
Bitcoin Weekly Trading Levels
Support Resistance
4827.4 5372.08
4598.7 5688.06
4054.02 6232.74
Key Trading Level: 5143.38