USD/JPY Trading Between 2 MAs, After Failing at the 100 Daily SMA


[[USD/JPY]] has been quite undecided since the pandemic started. It dived more than 10 cents lower during late February, but claimed back almost all the losses in March. Since then, this pair has been trading sideways, with a tendency to the downside.
Although, we saw another jump in the first week of June, but the climbed ended below 1.10 and reversed down again. The price fell to 106 last week, but this week the pressure turned to the upside again and USD/JPY has been climbing higher in the last several days.
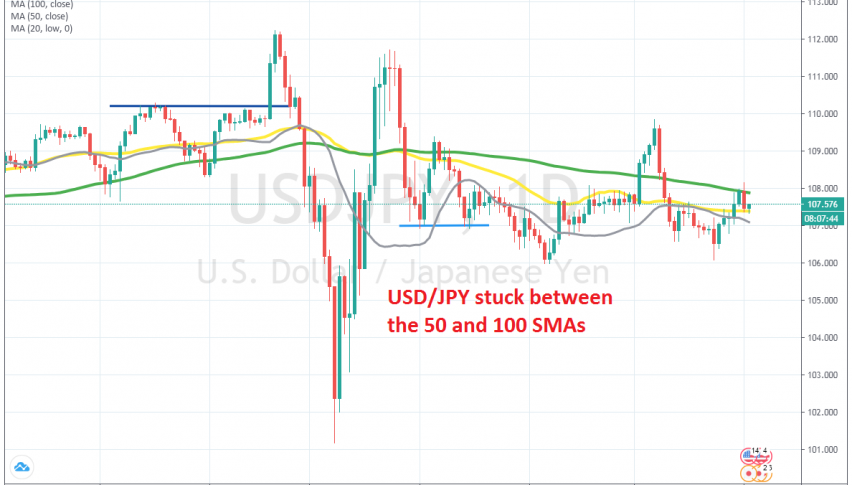
Although, as the daily chart shows, buyers failed to break above the 100 SMA (green) on the daily chart. That moving average held as resistance and rejected the price, but at the bottom, the 50 SMA (yellow) is providing support for USD/JPY on the daily chart. So, this shows that this pair is uncertain now and will be trading sideways for a few more sessions.