

[[USD/JPY]] turned quite bullish at the beginning of June, as the USD gained some strength after declining for a month, while the JPY turned bearish as sentiment improved on positive economic data from around the globe. But, the climb ended at 1.10 and USD/JPY returned back down.
Since then, this forex pair has traded mainly sideways, which shows uncertainty in the forex markets. I don’t blame traders, since the economic data is showing some sort of economic rebound, but the sentiment in markets remains mild.
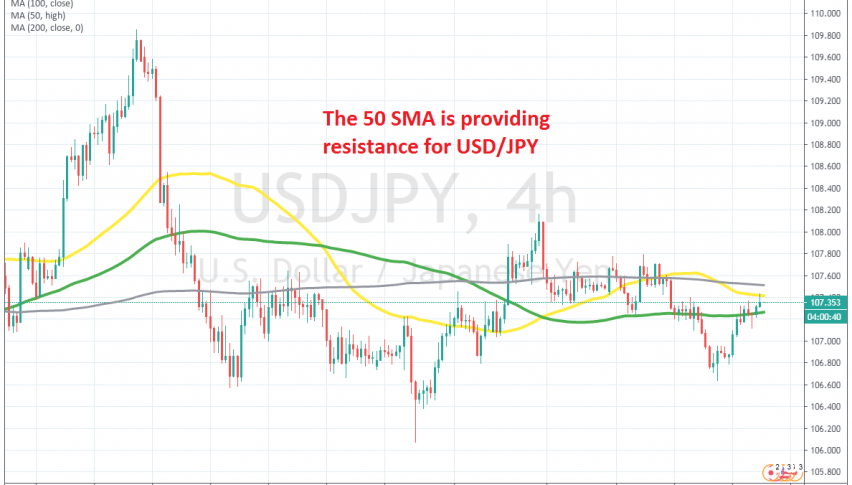
USD/JPY retraced higher last week, so yesterday we decided to sell this pair at the 100 SMA (green) on the H4 chart. But buyers pushed above that moving average, although they are finding trouble pushing above the 50 SMA (yellow) today. Now, it sees like buyers are exhausted and this pair is slipping lower, which is good for our forex signal here.