MAs Might Decide the Fate of Gold in the Short Term


GOLD has been bullish for two years and it turned even more bullish this year for obvious reasons. Since the middle of March, Gold has climbed more than $600, which is one of the steepest climb, comparable to the 2008, pre financial crisis climb.
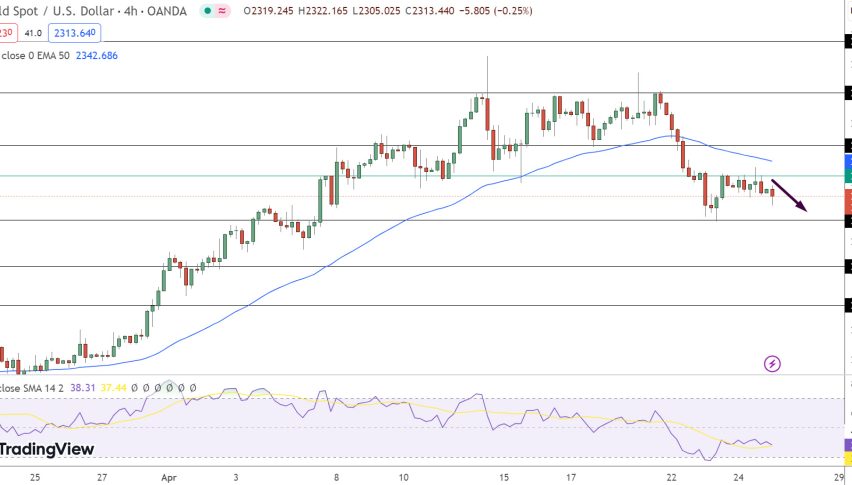
That climb took the price to all time highs, above $2,000 as well, topping at $2,075 around two weeks ago. Although, Gold formed a doji candlestick on the H4 chart right at the top, which is a reversing signal after the bullish move and the reversal came right after that.
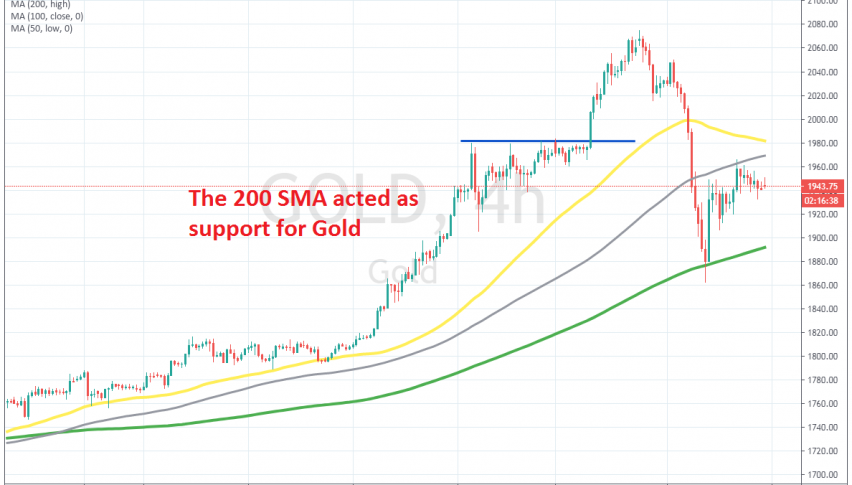
The decline was quite ferocious too, as Gold lost more than $200 in less than a week. But the decline stopped right at the 200 SMA (green) on the H4 chart. That moving average held as support and Gold bounced just over $100 off of it, but the bounce stopped right at the 100 SMA (grey).
So, Gold is bouncing between these two moving averages now and whichever way it breaks will be the direction for the next few sessions, of even for the week. We will follow Gold and will try to trade either the bounce between the MAs or the break of one of them.