AUD/USD Breaking the 100 Daily SMA, As the Bearish Momentum Picks Up Pace
AUD/USD has now broken below the 100 SMA, on the second attempt
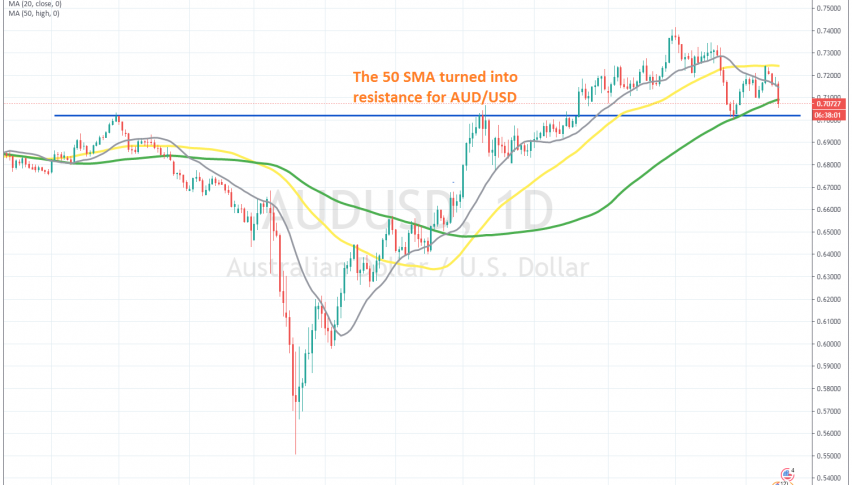
[[AUD/USD]] rallied more than 19 cents from the middle of March, following the coronavirus panic crash earlier that month. This is one of the few pairs which gained more since March, than what it lost during the crash, so the sentiment in AUD/USD has been quite bullish.
But, the bullish trend in this pair ended on September 1 and it started to reverse down after forming an upside-down hammer candlestick above 0.74, which is a bearish reversing signal after the climb. The proper decline took place in September and this pair lost more than 400 pips, but the 100 SMA (yellow) held as support on the H4 chart at 0.70.
The price bounced higher off the 100 SMA, but the price was finding resistance at the 20 SMA (grey) last week. The 20 SMA was broken on Friday though and this pair moved higher to 0.7240s. That’s where the 50 SMA (yellow) was standing in this time-frame, which turned into resistance for AUD/USD.
The price started reversing down and yesterday’s comments from RBA’s Lowe about further rate cuts if necessary, sent this pair tumbling lower, breaking he 100 SMA today. So, AUD/USD has turned bearish now and the 0.70 level is the target now for sellers. We will try to sell retraces higher, probably to the 100 SMA on the H4 chart.
- Check out our free forex signals
- Follow the top economic events on FX Leaders economic calendar
- Trade better, discover more Forex Trading Strategies
- Open a FREE Trading Account
Related Articles


Sidebar rates
Related Posts
