Terra (LUNA) on a Bullish Run – Why $103 Could Drive Uptrend
Terra (LUNA) has reached an all-time high of $109, thanks to recent developments. Market sentiment has also remained positive in the last 24
Terra (LUNA) has reached an all-time high of $109, thanks to recent developments. Market sentiment has also remained positive in the last 24 hours, with Bitcoin trading near $48k. LUNA is one of Terra’s native tokens, and the Terra network facilitates the creation of customized blockchains and decentralized applications on its network.
Luna Foundation Group (LFG), a Singapore-based non-profit organization, recently purchased $3 billion in Bitcoin to provide additional security for Terra’s decentralized stablecoin, UST. Terra (LUNA) has gained 12% in the last week, and the coin has broken through its resistance level of $108 in the last 24 hours.
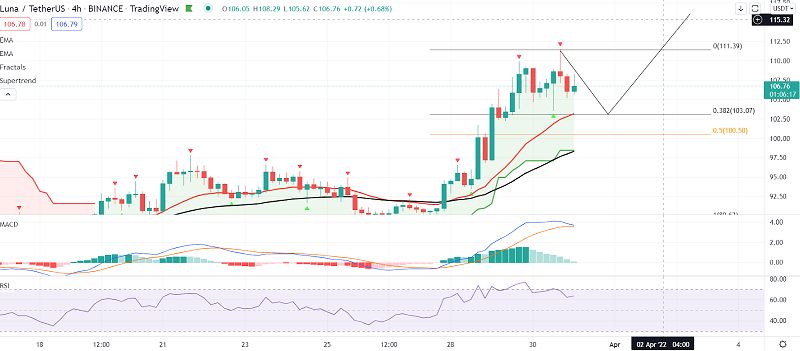
The cost of Terra (LUNA) is $108. LUNA/USD on TradingView is the source of this image. Terra (LUNA) was trading at $108.47 after reaching an all-time high of $109 just 24 hours ago. The coin’s immediate resistance levels were $110 and $112, respectively. In a pullback, prices could fall to around $103, $100, and then $95.
The altcoin has returned an 18% ROI over the last month. Terra’s (LUNA) trading volume has increased in recent trading sessions, with the previous session closing in green, indicating bullish momentum in the market. It also indicates that at the time of writing, buyers outnumbered sellers.
Terra (LUNA/USD) Technical Outlook
Terra (LUNA) has seen significant buying power. LUNA has grown exponentially over the last month, and technical indicators continue to point to market bullishness. However, it is difficult to predict whether LUNA will experience a correction in the coming trading sessions. As the coin reached an all-time high, the Relative Strength Index showed overbought tendencies.
At the time of writing, the RSI had recovered from the 75-point level but was still hovering near overvalued and overbought territory. This indicated a slight decrease in buying pressure over the last few trading sessions; if the coin continues to experience the same level of buying strength, it may attempt to trade near the $109 and then $110 price levels.
Chaikin Money Flow was also consistent with the Relative Strength Index, indicating substantial capital inflows. In the charts, an excess of capital inflows reflected bullishness.
Terra (LUNA) four-hour chart showed bullish momentum. LUNA had been rising for the past week and a half, with price momentum favoring the bulls. In the last trading session, LUNA experienced a bullish crossover on the MACD, representing the current price momentum. MACD also agreed with the other major indicators and remained bullish.
After the bullish divergence, MACD continued to show green histograms; however, these green histograms were seen declining. However, it is too early to tell if LUNA’s prices will fall based on the MACD’s reading.
- Check out our free forex signals
- Follow the top economic events on FX Leaders economic calendar
- Trade better, discover more Forex Trading Strategies
- Open a FREE Trading Account
- Read our latest reviews on: Avatrade, Exness, HFM and XM
Related Articles


Sidebar rates
Related Posts
