The Robinhood Markets, Inc. (HOOD) stock has shown remarkable momentum in recent weeks, with bullish signals emerging across multiple timeframes.
Robinhood (HOOD) Targets 0.382 Fib Level at $36.8
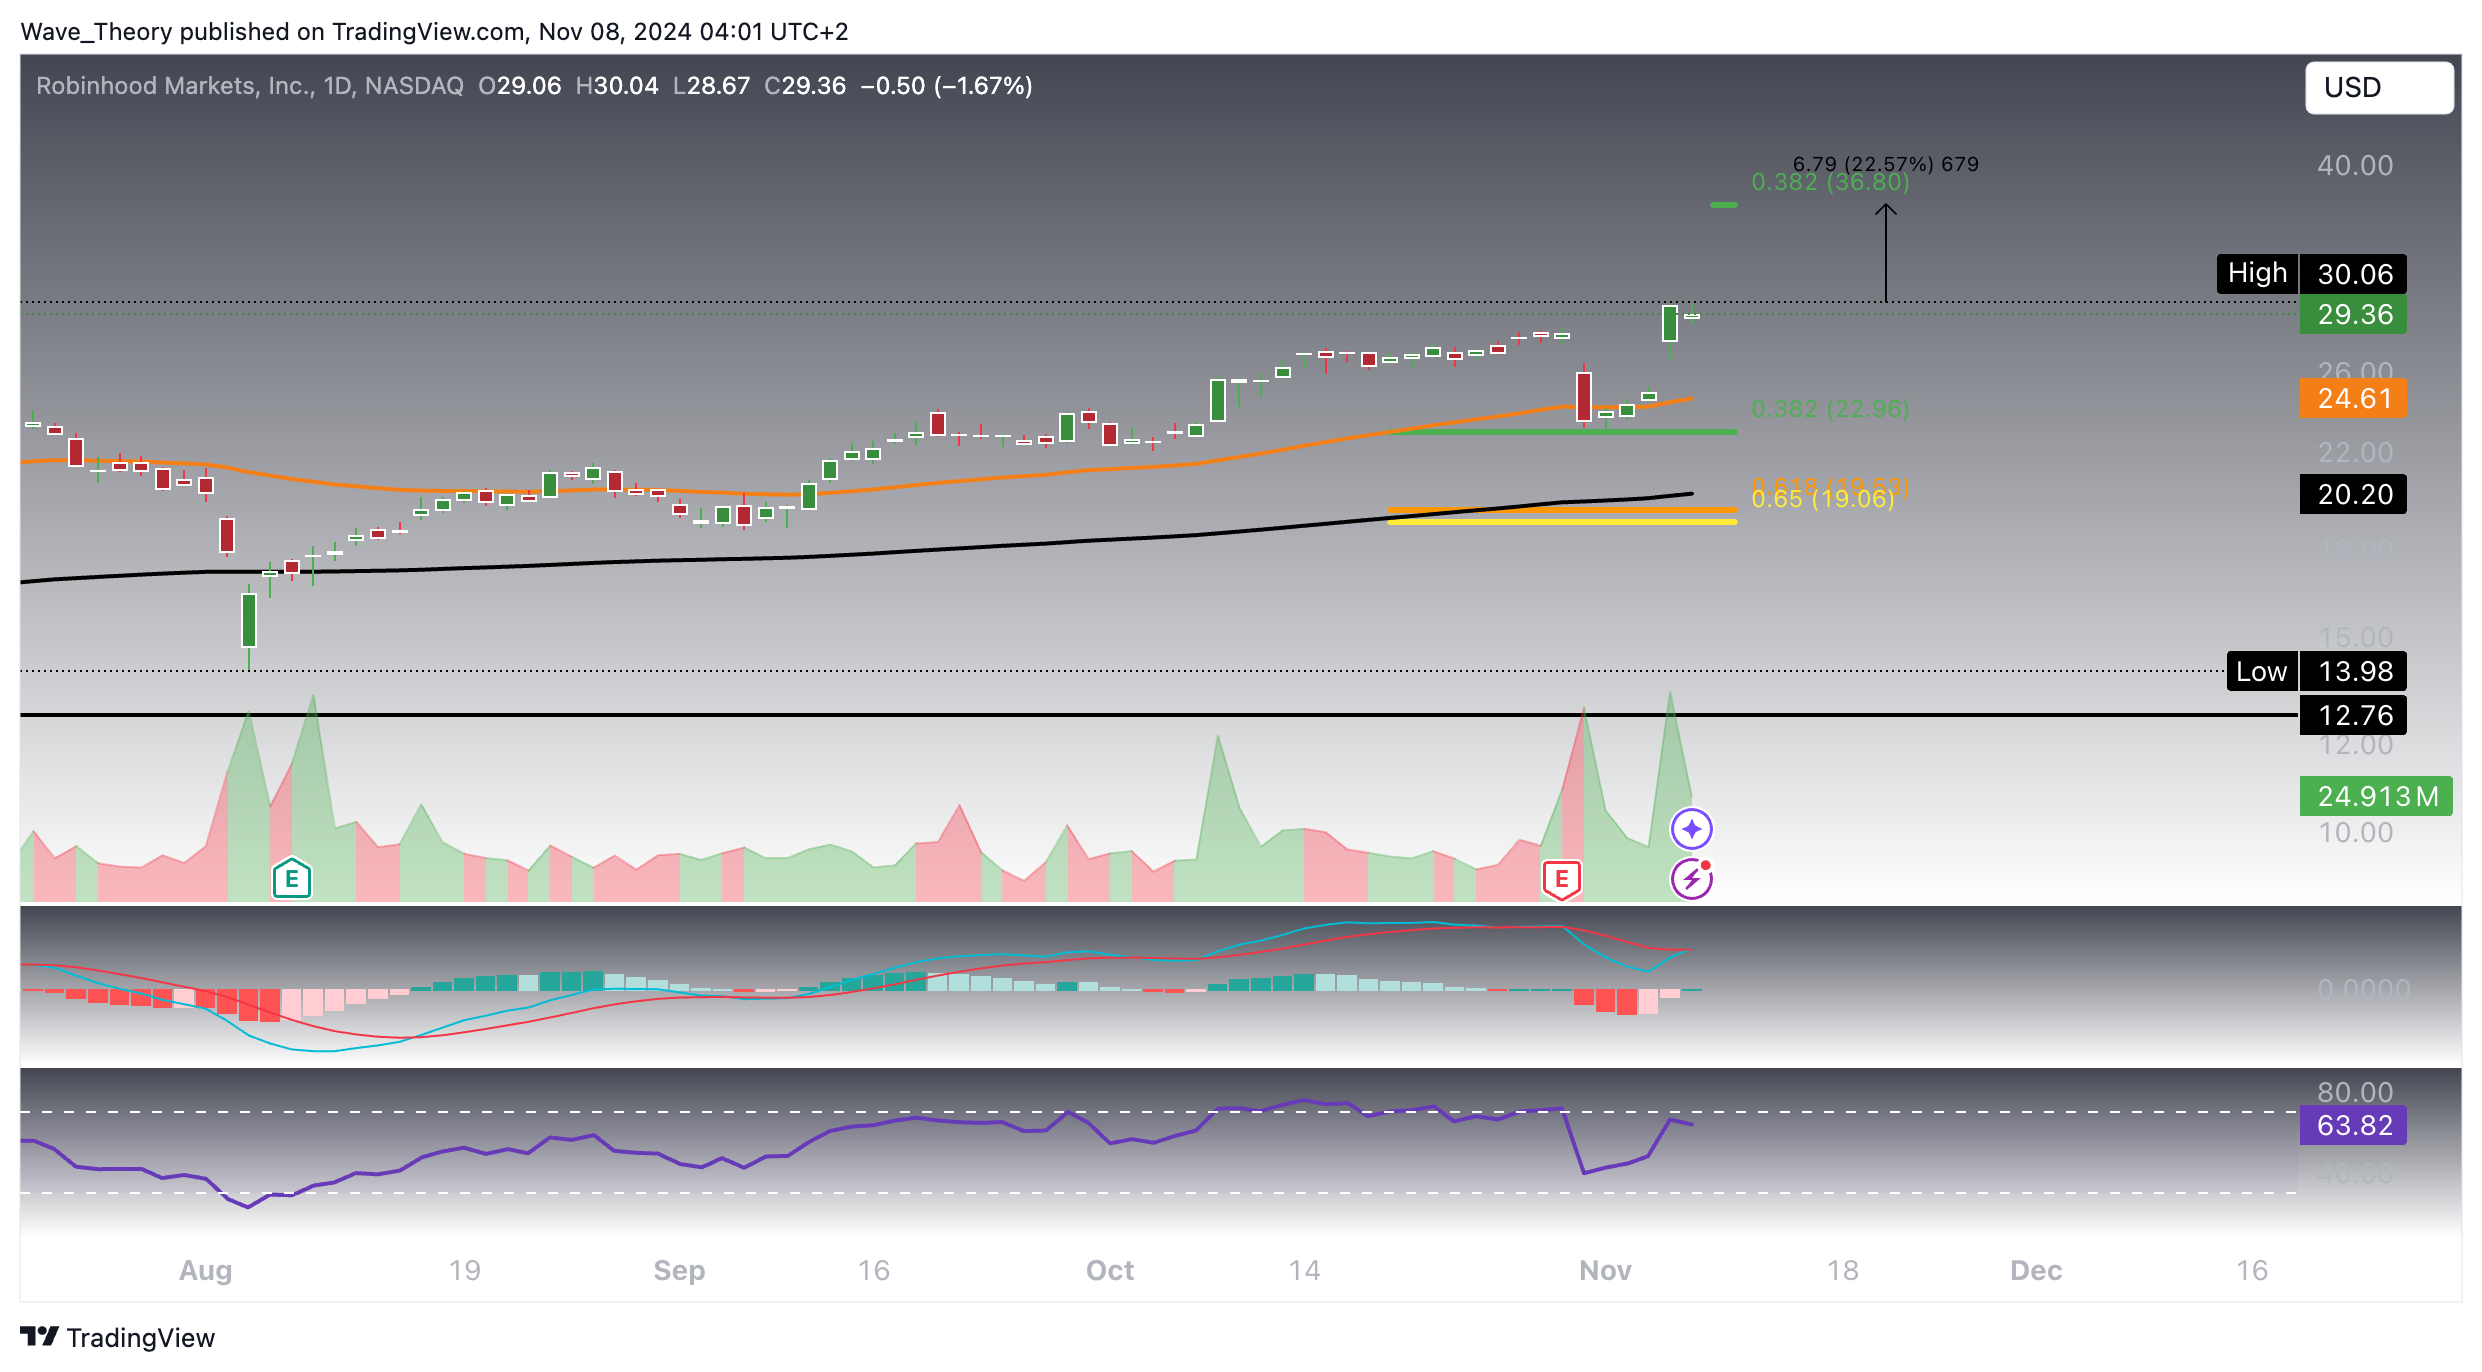
After a corrective phase, HOOD retraced to the 0.382 Fibonacci support level at $23, where it found strong buying interest and rebounded sharply. This led to a substantial rally, pushing the price to $30.Looking ahead, the stock has a clear upside potential, targeting the next Fibonacci resistance level at $36.8, which suggests further growth of approximately 22.6%. On the technical front, the MACD histogram has been ticking bullishly for the past three days, indicating increasing buying pressure. Additionally, the MACD lines are approaching a bullish crossover, reinforcing the positive outlook.
However, it’s important to note that the RSI is nearing overbought territory and forming a bearish divergence, which could signal potential weakness or a pullback. Despite this caution, the EMAs have already formed a golden crossover on the daily chart, affirming a strong bullish trend in the short to medium term. Given the overall positive market sentiment, particularly with favorable economic conditions, Robinhood appears poised for further gains as it approaches the $36.8 resistance level.
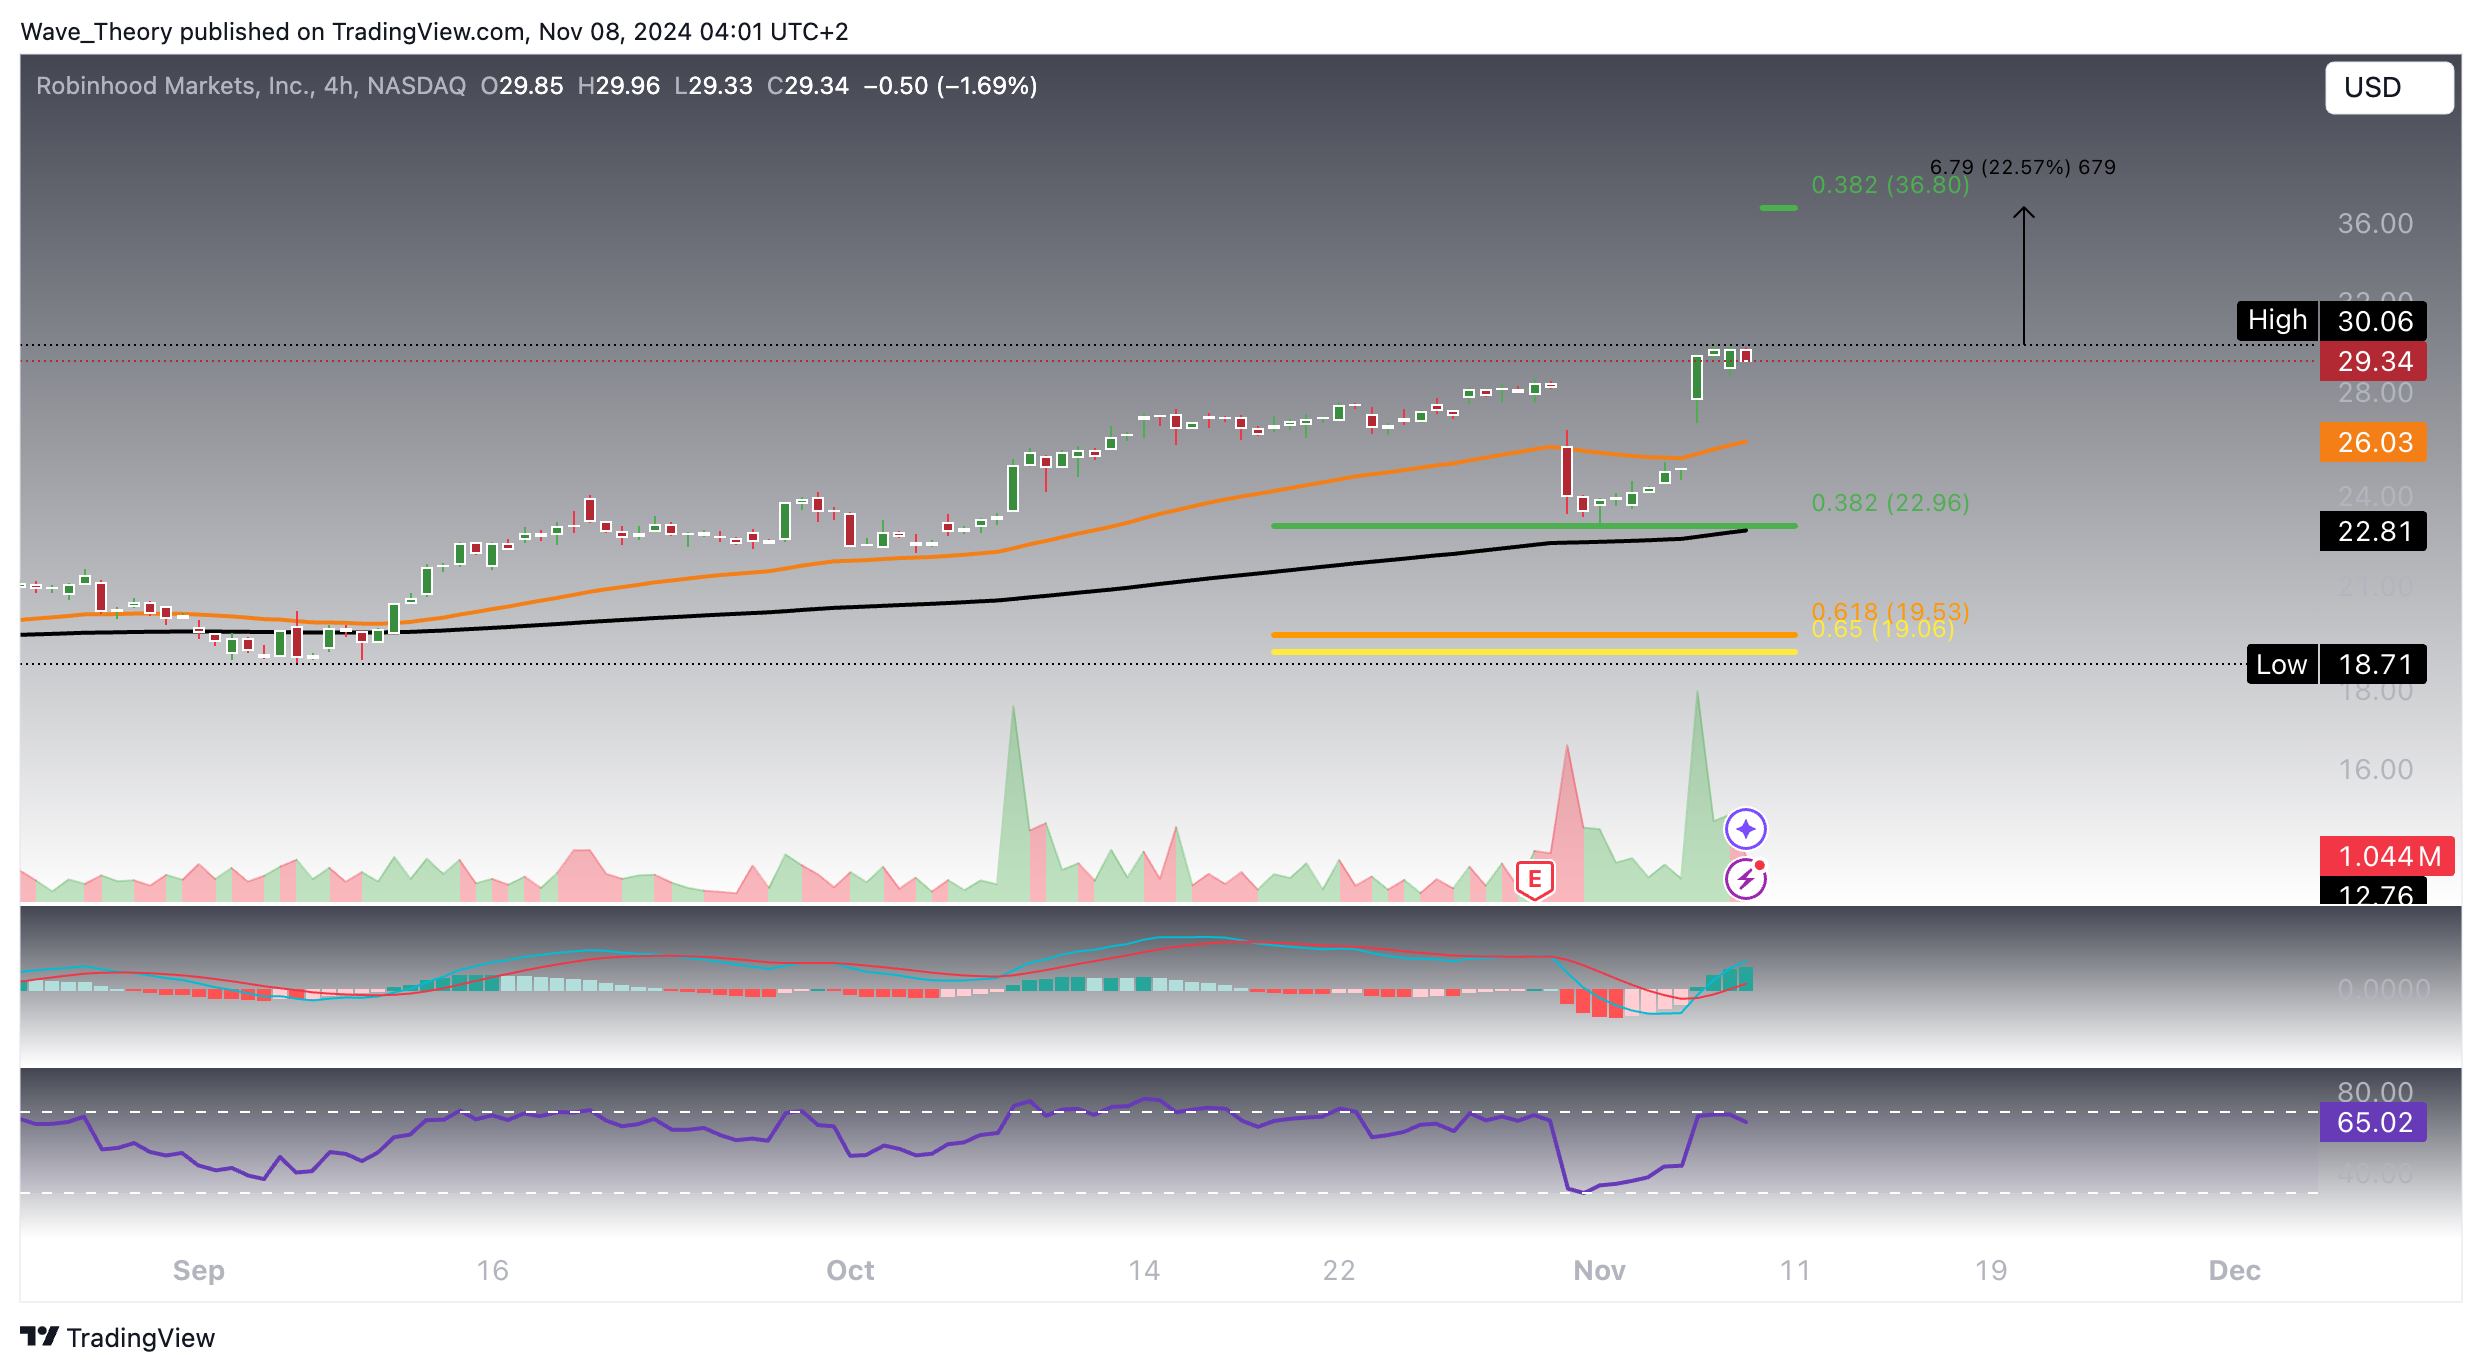
The 4-hour chart for Robinhood (HOOD) shows a strong bullish outlook. Key technical indicators confirm this sentiment:
Golden Crossover: The EMAs have recently formed a golden crossover, signaling a robust uptrend in the short term.
MACD: The MACD lines are crossed bullishly, with the histogram ticking higher, suggesting increasing buying momentum.
RSI: While nearing overbought territory, the RSI seems to form a bearish divergence, signaling caution to buyers.
If Robinhood (HOOD) experiences a correction, it finds crucial support at the 50-period 4-hour EMA near $26, and a more significant level at the 200-period 4-hour EMA around $22.8. Should these levels fail, the next key Fibonacci support lies at $19. As long as the price remains above the golden ratio at $19, the bullish trend remains intact. This level would act as a critical threshold, and holding above it would confirm that the bullish momentum is still in play, even during potential pullbacks.
Robinhood
Robinhood (HOOD) Stock Experienced Growth Of 28.6 % Since Last Weeks Low
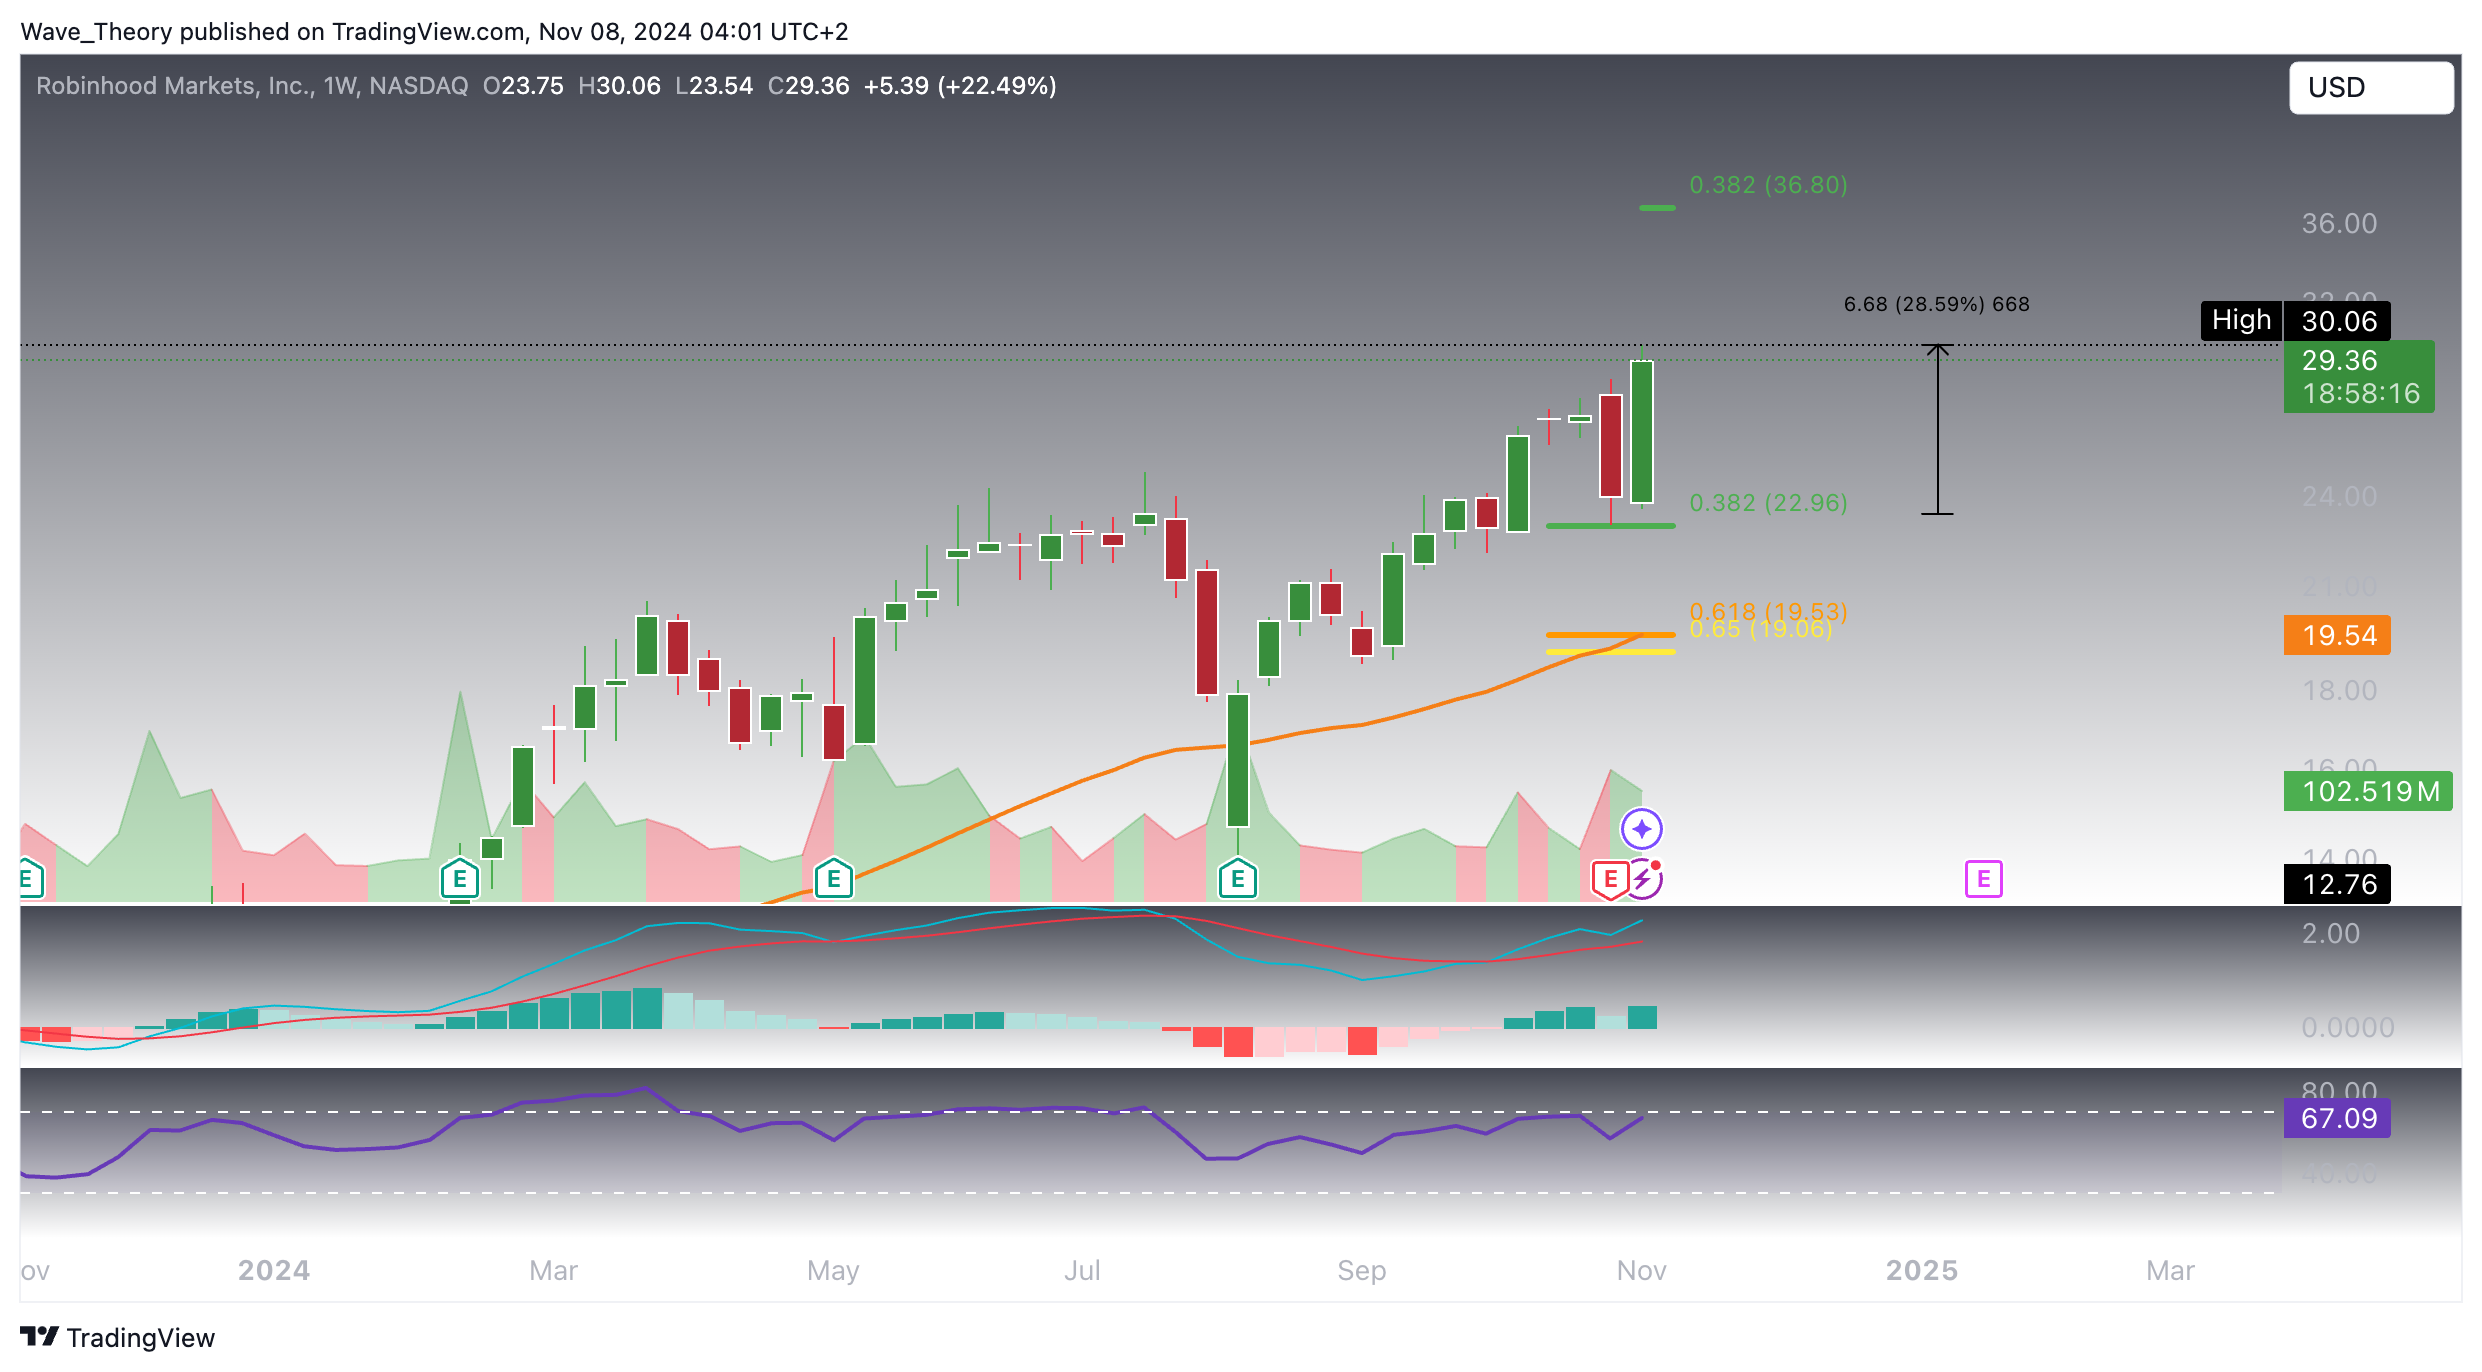
Since reaching a low at the Fibonacci support level last week, Robinhood (HOOD) has seen a robust surge of 28.6%, highlighting a resurgence in bullish momentum. The rally is confirmed by key technical indicators showing strength on the weekly chart. The RSI is oscillating in neutral territory, offering no immediate warning of overbought conditions, while the MACD histogram has started to tick higher this week, indicating a shift towards increasing buying pressure. The MACD lines also remain in a bullish configuration, reinforcing the upward momentum.
As Robinhood embarks on a path toward the next Fibonacci resistance at $36.8, it is important to monitor the 50-week EMA, which serves as a strong support level at the golden ratio of $19. Holding above this key support level would keep the broader bullish outlook intact, even amid short-term corrections.
Robinhood
Could The Robinhood Stock Potentially Reach $58
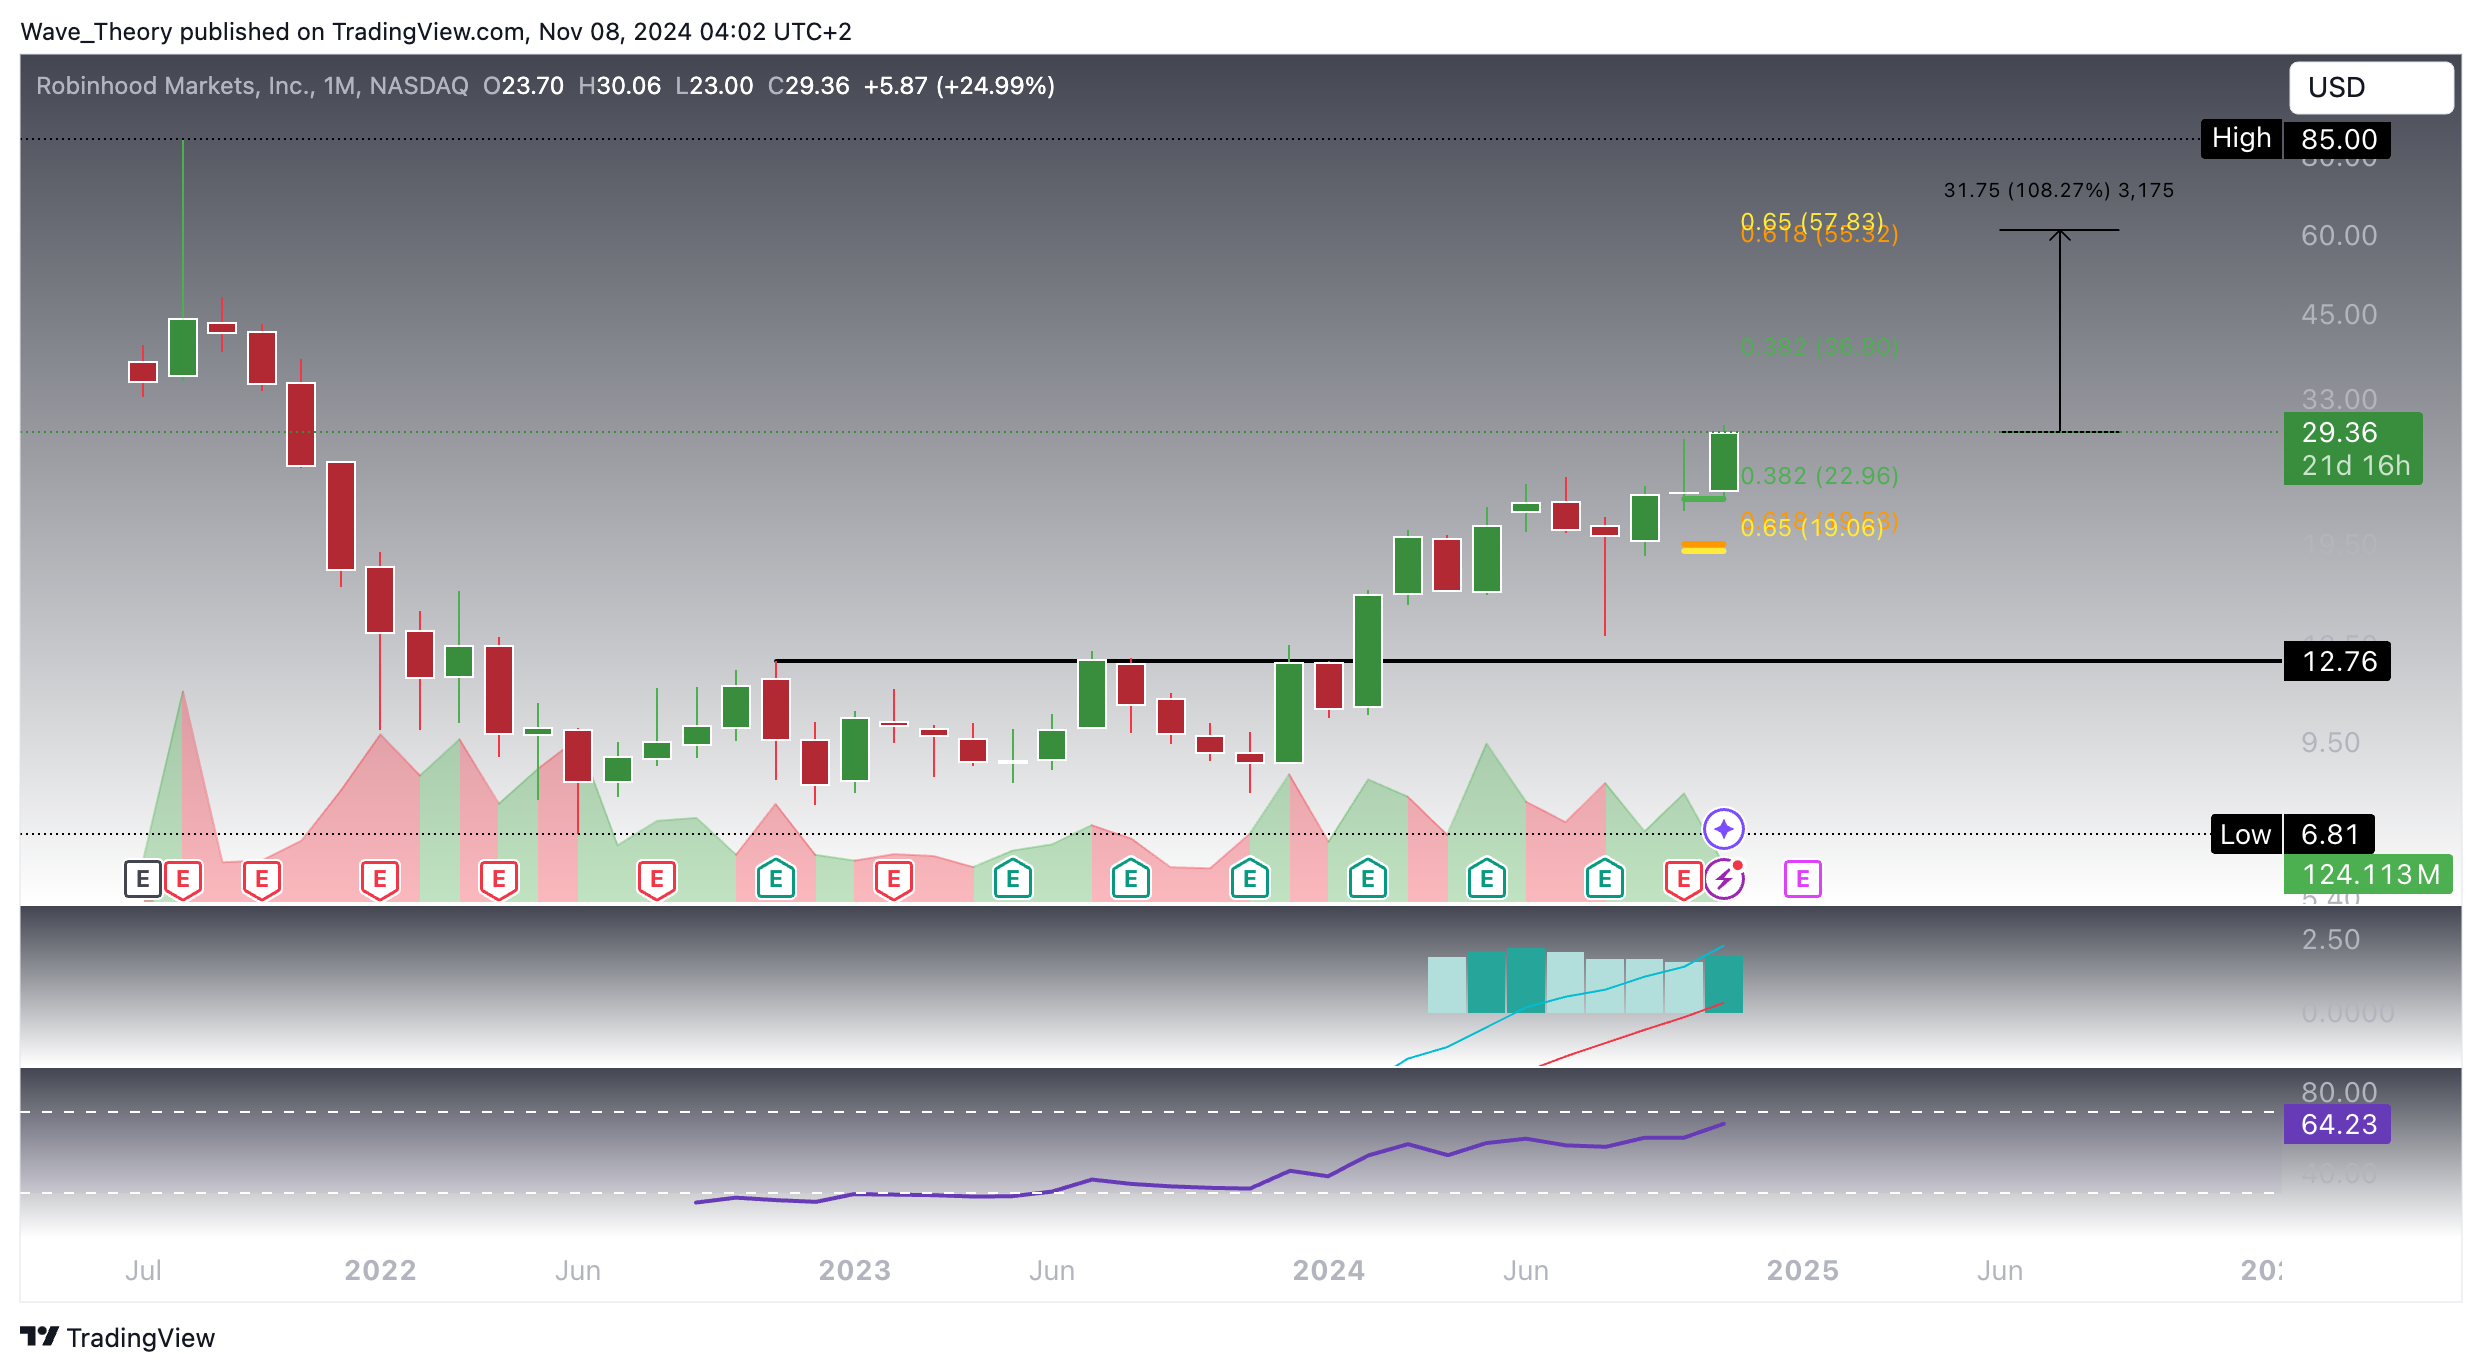
Should Robinhood (HOOD) break through the 0.382 Fibonacci resistance at $36.8, the stock could experience a substantial rally toward the golden ratio level at $57.5. If this level is breached, the stock could potentially retest its all-time high (ATH) of $85 or even push beyond it, signaling a strong continuation of the bullish trend.
The technical outlook is further reinforced by the bullish MACD histogram uptick, which has emerged after four months of downward movement. The MACD lines are also crossed bullishly, suggesting increasing bullish momentum. Meanwhile, the RSI remains neutral, showing neither overbought nor oversold conditions, indicating that the stock has room to move in either direction without any immediate reversal signals.
Robinhood
Additionally, the simultaneous surge of Bitcoin (BTC) to a new ATH is expected to catalyze a broader crypto bull cycle, which aligns well with Robinhood’s valuation. Given that Robinhood’s platform is heavily tied to crypto trading, favorable crypto market conditions are likely to support further growth in Robinhood’s stock price, as increased crypto trading volume directly benefits Robinhood’s business model. This synergy could facilitate further gains for the stock, reinforcing its bullish outlook in the near term.
Konstantin Kaiser comes from a data science background and has significant experience in quantitative trading. His interest in technology took a notable turn in 2013 when he discovered Bitcoin and was instantly intrigued by the potential of this disruptive technology.