CAC Enters Bear Trend After Trumps Slaps Extra Tariffs on EU Goods
The CAC index loses 5% in 2 days as recession fears increase on a possible global trade war.
Live CAC Chart

The CAC index loses 5% in 2 days as recession fears increase on a possible global trade war.
- CAC Drops nearly 10% from ATH
- Threat of global tariff war sinks in
- New car registrations decline 14.5%
The CAC continued to slide lower today opening down 1.5% on the day, after a drop of 3.5% yesterday.
Trump Tariffs Push CAC into Bear Trend
The Tariffs Trump announced on Tuesday reverberated throughout the global stock market. The CAC index lost 3.5% in one day alone on Wednesday and continues to slide on today’s open.
Investors are concerned about the effect the retaliatory tariffs will have on exports. But they also have a weak domestic market as recent economic data continues to show.
The CAC index managed a new all-time high on March 6, on hopes of a Ukraine-Russia peace deal and domestic political stability.
However, the peace deal seems to be moving further away and now investors have to face the reality of higher-than-expected tariffs.
CAC Live Chart
Economic Data Still Weak
Today’s economic data was mixed. Industrial Production increased more than forecast at 0.7% compared to -0.5% contraction last month.
While PMI for construction came in lower than expected at 43.8, which is an improvement from last month’s 39.8 but still below the expansion level of 50.
New car registrations dropped faster than the forecast of -0.7%, at -14.5% fewer sales than the same period in 2024.
Technical View
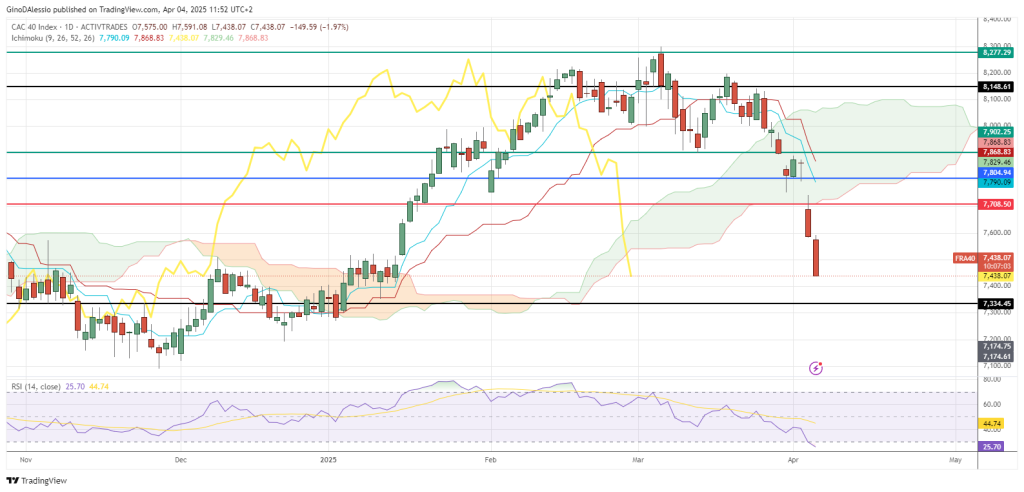
The chart above for the CAC shows a market that has entered a full-on bear trend. Price is below the Ichimoku cloud and with today’s candle at this level, the Lagging line (yellow line) should also close below the cloud.
The RSI has dipped below the level of 30, on the day chart this is not usually sustained for long periods. So, we may see some level of correction from here.
- Check out our free forex signals
- Follow the top economic events on FX Leaders economic calendar
- Trade better, discover more Forex Trading Strategies
- Open a FREE Trading Account
Related Articles


Sidebar rates
Related Posts
