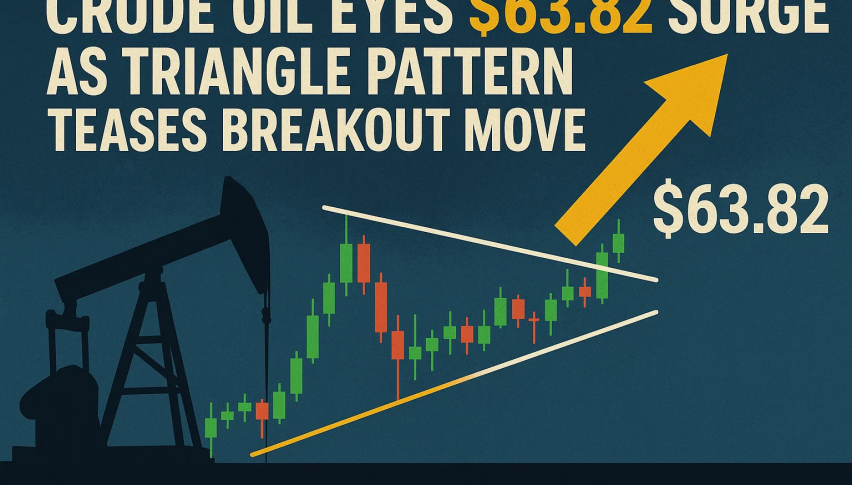
Crude Oil Eyes $63.82 Surge as Triangle Pattern Teases Breakout Move
WTI crude oil futures traded around $62.50 on Monday as traders weighed in on the escalating geopolitical and economic risks.
Quick overview
- WTI crude oil futures are trading around $62.50 amid rising geopolitical and economic risks, particularly concerning Iran's nuclear talks.
- Moody's downgrade of the US government's credit rating has added to global market anxiety, despite a recent 1% gain in crude oil prices due to a tariff pause between the US and China.
- Technical analysis indicates a symmetrical triangle pattern in WTI crude, suggesting an imminent breakout with key resistance at $62.15 and support near $61.20.
- Traders are advised to wait for a confirmed breakout before entering positions, with potential targets set for both bullish and bearish scenarios.
WTI crude oil futures traded around $62.50 on Monday as traders weighed in on the escalating geopolitical and economic risks. Iran’s president reiterated the country’s commitment to nuclear talks with the US but rejected pressure tactics. The standoff is adding uncertainty to the energy market especially with Iran’s oil supply on the line.
Moody’s downgraded the US government’s credit rating on Friday citing long term fiscal health concerns. That added to the already nervous global markets.
But not all is bearish. Last week crude gained 1% after the US and China agreed to a 30 day pause in tariff hikes – good news for the world’s two biggest energy consumers. The US and China also agreed to a 90 day pause in tariff hikes – good news for the world’s two biggest energy consumers. President Trump also said he will speak with Russian President Putin about ending the Ukraine war – if that leads to real progress it could impact energy supply chains.
WTI Crude Oil – Technical Analysis Point to Breakout Setup
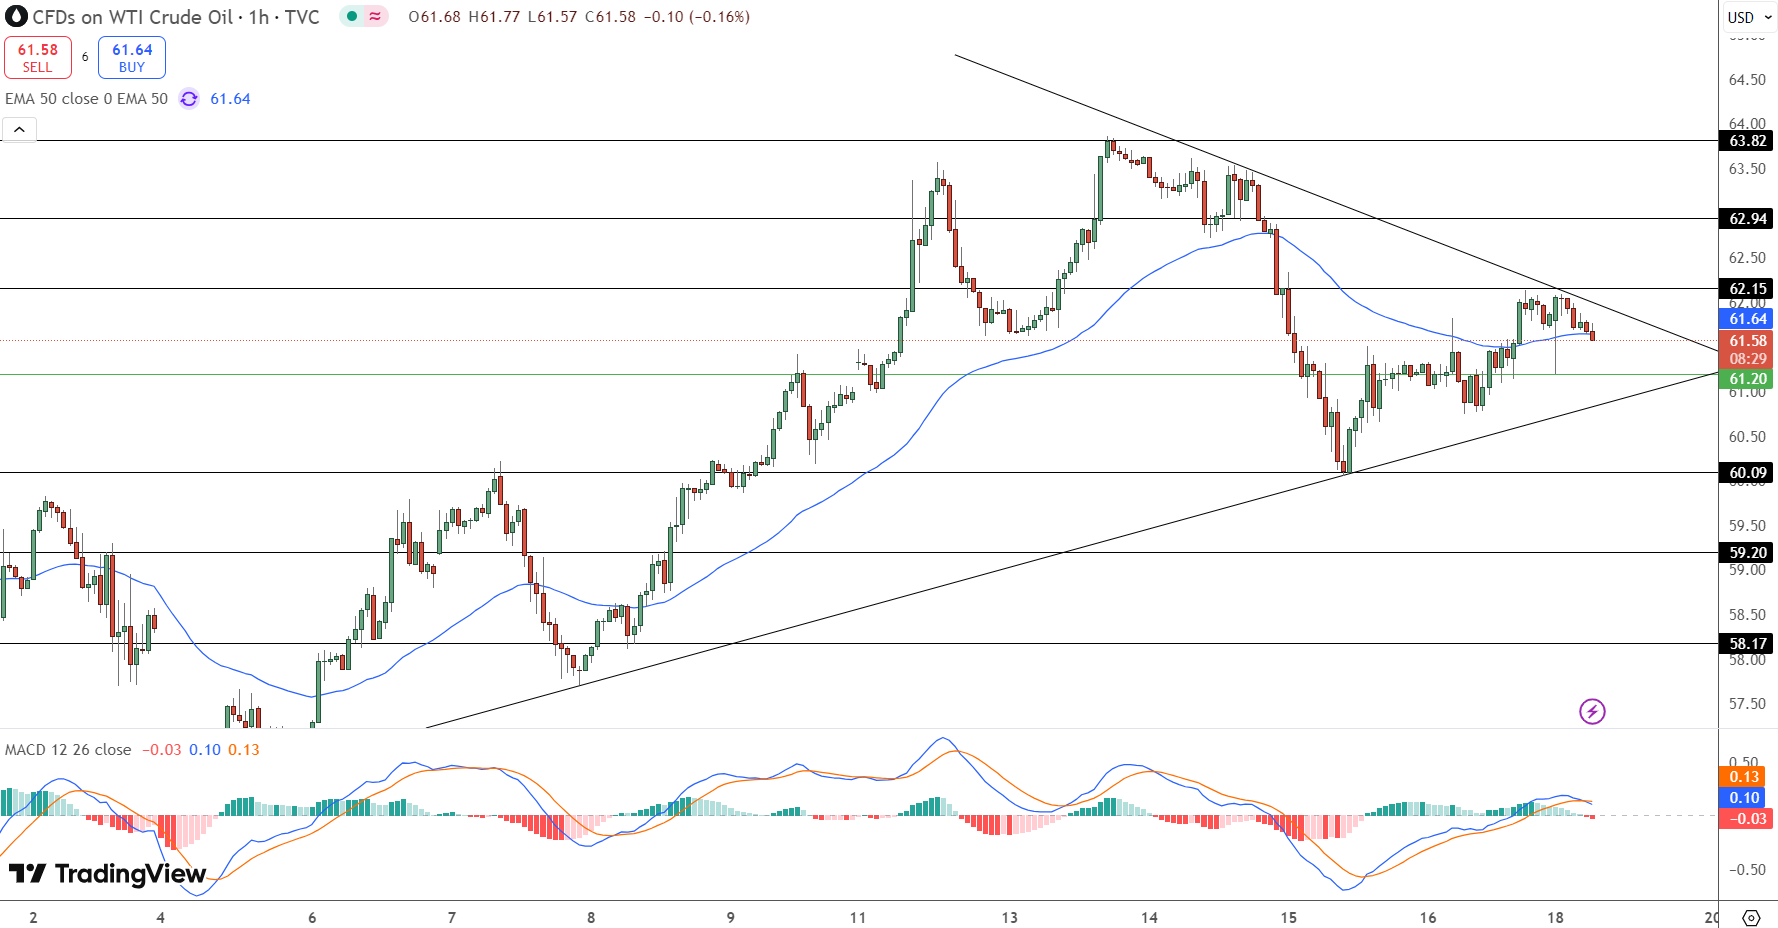
The 1 hour WTI crude chart shows a symmetrical triangle tightening between resistance at $62.15 and support near $61.20. Price is compressing towards the apex, a breakout is imminent.
Key technicals:
-
50-EMA at $61.64 is now resistance after a failed retest
-
Recent candles are spinning tops and Dojis, market is indecisive
-
MACD crossover to the downside is softening bullish momentum
-
Higher lows from $60.09 still support the bullish case if buyers regain strength
The direction of the breakout is unknown but the setup is clean.
Trade Setup for All Market Conditions
For traders watching this chart pattern unfold, here’s how to approach it:
-
Bullish breakout setup
-
Confirm on close above $62.15
-
Target zones: $62.94 and $63.82
-
-
Bearish breakdown setup
-
Confirm on close below $61.20
-
Targets: $60.09, followed by $59.20
-
-
Stop-loss placement
-
Just beyond either side of triangle breakout
-
Think of this triangle as a compressed spring—eventually, the pressure has to release. Let the price action break and close outside the triangle before jumping in.
- Check out our free forex signals
- Follow the top economic events on FX Leaders economic calendar
- Trade better, discover more Forex Trading Strategies
- Open a FREE Trading Account
Related Articles

Comments
Sidebar rates
Related Posts
