Gold Price Eyes $3,228 Breakout as Moody’s Downgrade and Trump Tariffs Hit
Gold up on Monday after brutal week as investors flee to safe havens amid US trade tensions and Moody’s downgrade.
Quick overview
- Gold prices rose on Monday after a challenging week, driven by investor demand for safe havens amid US trade tensions and a downgrade from Moody's.
- The downgrade of the US sovereign credit rating and renewed tariff threats from Treasury Secretary Scott Bessent have contributed to increased volatility in the market.
- Analysts suggest that gold performs well in uncertain environments, particularly with expectations of potential rate cuts from the Federal Reserve.
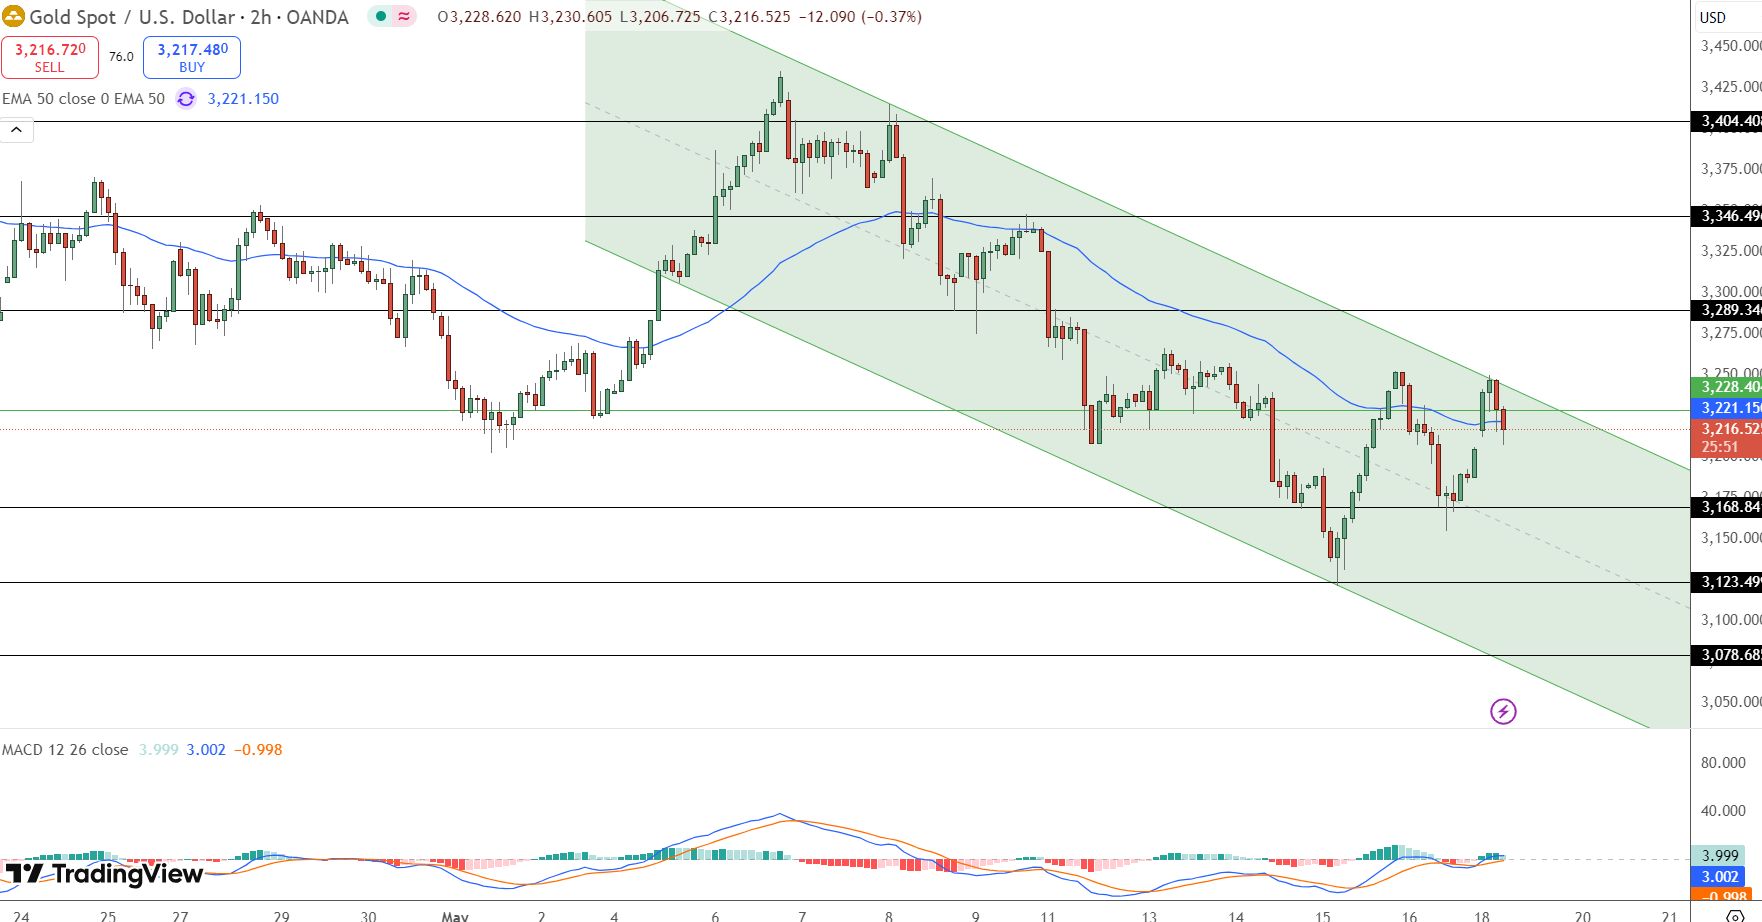
- Technically, gold is currently in a descending channel, with key resistance at $3,221 and potential targets for short positions at $3,168 and $3,123.
Gold up on Monday after brutal week as investors flee to safe havens amid US trade tensions and Moody’s downgrade. Dollar index (DXY) down 0.3% making gold cheaper for international buyers.
The spark? Two things. First, Moody’s downgraded the US sovereign credit rating by one notch on Friday citing growing concerns over US debt. Second, Treasury Secretary Scott Bessent said countries that don’t negotiate in “good faith” will get hit with Trump’s tariffs.
KCM Trade’s Chief Market Analyst Tim Waterer said:
“The downgrade and risk-off tone has given gold new life.”
Gold fell 2% on Friday, its worst week since November as US-China trade truce boosted risk appetite. Now that optimism is fading and volatility is back gold is back in play.
Gold and the Fed: Will Trade Policy Change the Timeline?
Gold loves uncertainty—and right now there’s plenty of that. Trump’s return to tariff threats could bring back the kind of market stress we saw during his first term when trade wars rocked global supply chains.
Meanwhile US inflation data last week was mixed:
-
Producer prices (April): Unexpected decline
-
Retail sales: Slower than expected
-
Consumer prices: Below forecast
All of which points to rate cuts sooner rather than later. “We could see a Fed cut by July or September,” Waterer said. “A lot depends on how these trade talks go.”
Gold is strongest in a falling rate environment where opportunity costs are lower for holding non-yielding assets.
Gold Price Forecast: Levels to Watch This Week
From a technical perspective gold (XAU/USD) is stuck in a descending channel on the 2-hour chart currently at $3,216. It has failed three times to break above the channel resistance and the 50-period EMA at $3,221.
Notable signals:
-
Shooting star candle near resistance suggests fading buying pressure.
-
MACD histogram is weakening
-
Channel still in play with lower highs and lower lows.
Trade:
-
Short: If price gets rejected at $3,221
-
Targets: $3,168 and $3,123
-
-
Breakout Buy: Above $3,228 with strong candle
-
Stop-loss: Outside the channel
-
Think of the chart like a slanted tunnel. Unless gold goes through $3,228 it’s more likely to go down than up.
- Check out our free forex signals
- Follow the top economic events on FX Leaders economic calendar
- Trade better, discover more Forex Trading Strategies
- Open a FREE Trading Account
- Read our latest reviews on: Avatrade, Exness, HFM and XM
Related Articles
Sidebar rates
