Bitcoin Price Prediction: $105K Triangle Unwinds—Next Move to $108K or $102K?
Bitcoin Price Prediction: Triangle near $105K hints at breakout to $108K or breakdown to $102K. See the key levels and trade plan.

Quick overview
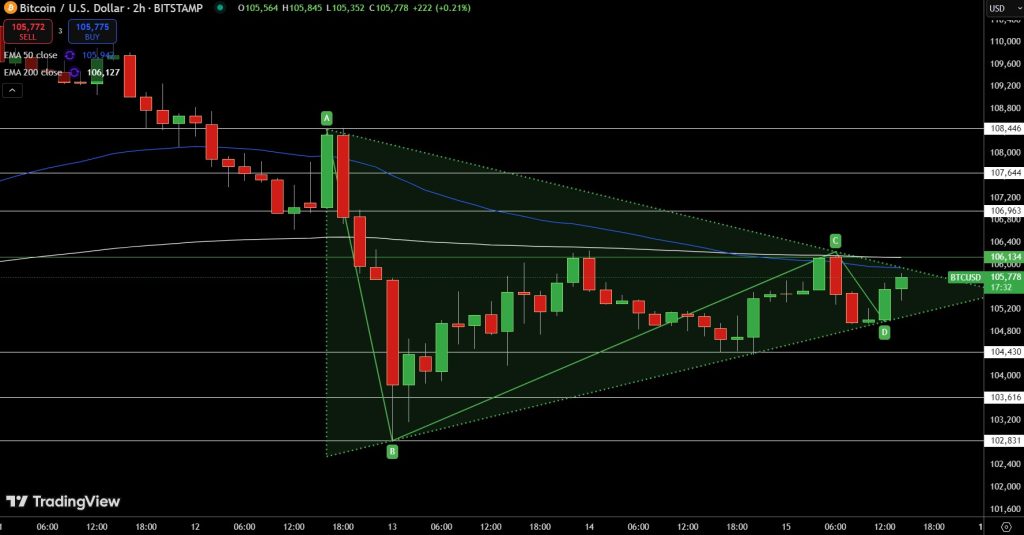
Bitcoin is forming a classic symmetrical triangle on the 2-hour chart, with prices tightening between mid-June lows ($102,831) and highs around $106,134. Today’s price is hovering near $105,443, supported by a substantial $36.6 billion in daily trade volume, indicating an equilibrium between buyers and sellers.
Within this triangle, higher lows and lower highs reflect a neutral consolidation, waiting for a breakout.
The 50-period EMA sits just overhead at $105,941, while the 200-period EMA at $106,126 adds a second layer of resistance. A recent bullish engulfing candle at the lower trendline signals renewed buyer interest. Yet, softer candles, like Dojis suggest a tug of war rather than a decisive shift.
Momentum indicators suggest that the RSI is holding around 50, and the MACD is gradually narrowing, hinting at a potential upward reversal. Crucially, we’re not seeing bearish formations like “three black crows,” a subtle green light for upside potential, at least temporarily.
Bitcoin Resistance Levels That Matter
Technical traders are watching these key thresholds for BTC/USD :
- $106,134 – Breakout level clearing both EMA resistances
- $107,644 – First take‑profit beacon at Fibonacci 1.0 extension
- $108,446 – Secondary target aligning with upper trendline
On the flip side, upside potential falters here without volume:
- Still below EMAs, requiring strong buying momentum
- Triangle apex suggests the move could arrive in days
Bitcoin Trade Idea
Here’s a simple, disciplined setup:
- Entry (Long): Wait for a 2‑hour candle to close above $106,134, breaking clear of both EMAs with volume
- Target 1: $107,644
- Target 2: $108,446
- Stop-Loss: Below the most recent higher low ($104,430)
If the price breaks down instead:
- Entry (Short): Close under point B ($104,430) with volume
- Target: $102,831 (triangle base)
- Stop-Loss: Just above the candle that breaks support
Why This Setup Works
By waiting for a clear breakout or breakdown, you’re not guessing. A confirmed move above $106,134 could trigger a fresh, disciplined leg up. Conversely, a break below $104,430 minimizes risk by narrowing targets.
This symmetrical triangle picture gives structure: you’re not chasing a trend; you’re acknowledging range‑bound realities and only jumping in when the price confirms direction.
In short, Bitcoin’s triangle is the stage where the performance comes only after the breakout. Aim for clarity over speed and control exits tightly. Let the chart guide the trade.
- Check out our free forex signals
- Follow the top economic events on FX Leaders economic calendar
- Trade better, discover more Forex Trading Strategies
- Open a FREE Trading Account
- Read our latest reviews on: Avatrade, Exness, HFM and XM
Related Articles


Sidebar rates
Related Posts
