
Polkadot (DOT) Price Prediction For 2021: Buy The Dip Opportunity as DOT Trades Above Key Support Level


Last Update: January 11th, 2022
Current Updates
Just a few weeks ago, Polkadot (DOT) broke out of a short-term price consolidation to breach new all-time highs and hit our price forecast of $50.00 for the year 2021.
However, since then, there have mostly been more red days than green days for Polkadot (DOT). Since hitting new all-time highs, it has fallen as much as 25%, with traders taking profits and a choppy cryptocurrency market overall. DOT is currently sitting just above the key 50-day support level.
Polkadot (DOT) outperformed the major cryptocurrencies, Bitcoin (BTC) and Ethereum (ETH), over the past few weeks, but it has since corrected more sharply than both. There could be buy-the-dip opportunities, as it looks like DOT could become a new leader in the cryptocurrency space if it bounces above support levels in the coming days or weeks. A possible key catalyst for the short term would be the rollout of its “parachains”, which, if successful, could drive the price of DOT even further.
Polkadot (DOT) – Forecast Summary
| DOT Forecast: H2 2021 Price: $50 (Achieved) Price drivers: Bullish year-end crypto rally, BTC reaching all-time highs, Parachain launch | DOT Forecast: 1 Year Price: $80 – $100 Price drivers: Retail/Institutional adoption of crypto/NFTs, US tapering, Faster/cheaper blockchain technology | DOT Forecast: 3 Years< Price: $200 – 300 Price drivers: Price drivers: Creation of the Metaverse via the blockchain |
Polkadot (DOT) Past Price Analysis:
January 1, 2021 – Polkadot opened at a price of $9.26, and breached the $10.00 psychological resistance level to follow the strong rally from the overall cryptocurrency markets, and reach an all-time high of $49.78 by May 2021.
Then, the crypto market crash happened, and the price of DOT dropped to a low of $10.37, losing almost 80% of its value, from the all-time high. It is worth emphasizing the $10.00 level, which previously acted as a major resistance that drove the price to all-time highs, and is now acting as a strong support level for DOT. It never touched this level during the breakdown mid-year 2021, which signifies strong buying demand in this area.
DOT has since exhibited a resilient V-shaped recovery, which has almost erased and recovered the entire market crash to date, as it is trading currently at $41.35, which is just a few points below the all-time high levels. A bullish sentiment has indeed returned to the cryptocurrency market, led by Bitcoin (BTC), which is trading near all-time highs again, after also correcting sharply mid-year. DOT has been creating a tight consolidation over the past few weeks, just above $40.00. Finally, it broke out of this consolidation to trade at levels above $50.00 yesterday – a new frontier for DOT. Moving forward, as momentum continues to grow, we may see Polkadot rise even further, now that more eyes are watching and wanting to get in on the action.
Recent Changes in the Polkadot Price
| Period | Price | Change ($) | Change (%) |
| 2 Weeks | 49.98 | -7.44 | -15% |
| 1 Month | 42.12 | 0.42 | 1% |
| 6 Months | 28.96 | 13.58 | 47% |
| 1 Year | 4.50 | 38.04 | 845% |
POLKADOT Live Chart
Introduction to Polkadot Coin:
Polkadot (DOT) is an open-source blockchain technology that helps interoperability across different chains. DOT is Polkadot’s native token. It is used for governance, operations, bonding and staking. The Polkadot network allows for more flexibility, control and security for developers and users.
Their mission is to create an internet where personal identity and data are owned by the individual and not sold to corporations or any central authorities – a totally decentralized web where the users are in control, and not the large institutions of today. The Polkadot network empowers both the innovators and the users to build faster, cheaper and better solutions for society.
Polkadot is the chief project of Web3 Foundation, a Swiss foundation that funds the research and development of projects, with the mission of creating a more decentralized internet. The founders of Polkadot are Robert Habermeier, Dr. Gavin Wood and Peter Czaban. It is interesting to note that Dr. Wood is the co-founder of Ethereum.
Currently, Polkadot is the 8th-largest cryptocurrency in the market, with a market capitalization of $42.49B at the time of writing.
DOT Price Prediction for Year-end 2021
Forecasting the price of any financial security is usually a hit or miss business, because nobody can really predict the future. However, in trading and investing, you can definitely place a well-thought-out bet, based on favorable probabilities, as long as you understand and manage the risks, in the event that you are wrong.
In the case of DOT, predicting the year-end price could, first of all, be heavily influenced by the way the overall cryptocurrency market performs towards the end of the year. Big caps, like Bitcoin and Ethereum, had already rallied to near all-time high levels at the time of writing. Usually, what happens next is that capital flows from big to small market cap coins or Altcoins, such as Polkadot. We can expect that, after a rally in Bitcoin and Ethereum, the Altcoins will follow.
After looking at the overall market environment, the next logical approach would be to understand the intrinsic factors that could affect Polkadot in the near future. One such possible catalyst would be the launch of “Parachains”, which are new and improved, next-generation, layer-1 blockchains. These Parachains will be auctioned in batches, beginning on November 11 for the first batch, and December 23 for the second batch. If this program is successful, it could be a strong catalyst for a price rally in DOT at the end of the year.
Update: The year-end price prediction of $50.00 was indeed conservative, as it has already been hit as of today. With about two months to go before the year ends, let’s see how much higher DOT can fly.
DOT Price Prediction for 2024-25:
We may be looking too far ahead, but the long-term future for Polkadot and cryptocurrencies in general, is definitely bright. Here are the reasons why I believe Polkadot (DOT) could reach the price of $200-300 in three to four years.
- Continued retail adoption
- Institutional acceptance of cryptocurrency: ETFs, crypto funds, hedge funds
- The explosive popularity of NFTs
- The gamification of finance
- US tapering could drive capital flows from traditional financial markets towards crypto
- Polkadot’s cheaper, faster, more flexible parachains
Monero Coin (XMR) Forecast for 2021: Will the XMR/USD Continue to Rise in 2021?
Ethereum (ETH) Price Prediction For 2021: Will Buyers Break 2017 Highs Soon?
DOT Technical Analysis – BTFD!
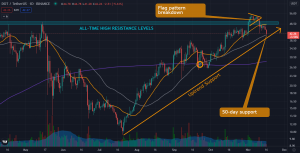
UPDATE: Last week’s recommendation to buy the momentum flag pattern did not materialize, as the buy trigger did not follow through. Instead of breaking out of the flag pattern, DOT did the opposite and actually broke down below the flag pattern support, as the sharp correction continued. DOT fell below the 20-day moving average (yellow line) and is currently sitting just above the key 50-day support level (gray line). This now presents a possible “buy-the-f***ing-dip” (BTFD!) opportunity.
Here are other key observations from the DOT/USD daily timeframe chart:
- Resilient. Shows a strong V-shaped recovery from the mid-year crash.
- Golden Cross. The 50-day moving average (gray line) crossed over the 200-day moving average (purple), suggesting a change from bearish to bullish sentiment.
- Momentum Indicator Weakens. The Average Directional Index (ADX), which is a momentum indicator, has been showing weakness, as it is already below the key level of 25.00, which means DOT’s upward move is losing momentum.
- DOT overshoots to all-time highs but fails to sustain the move.

- MACD cross-down indicates increasing bearishness, which suggests more corrections or consolidation are on the way.

Recommendation: Wait for a green candle or strong signs of a bounce before buying the dip above the 50-day moving average support level. It is absolutely crucial to wait for signs of accumulation in this area before taking a position, because we do not want to catch a falling knife. The short-term bias for DOT is still negative, selling pressure is still present and we would like to see this wane first, before entering. It is vastly important to tranche up your positions over a span of days, in order to manage your risk.
Trade Idea: Buy the Dip if it holds
Buy:
Tranche 1: At the 50-day support level (smallest allocation, just to feel the move)
Tranche 2: Above 50-day MA levels on the first green candle (bulk of your allocation for this trade should be here.)
Tranche 3: Above 50-day MA levels on the 2nd green candle (final position)
Stop loss: $36-$38
*DOT could fall further if the bounce does not materialize. Trim positions at the first sign of weakness.
Target Price: $56-60 (All time high levels)
About the author
Jose Maria Miguel Marquez is a Certified Securities Specialist of the Philippine Stock Exchange and is an equities and cryptocurrency momentum trader with almost a decade of experience. He specializes in technical analysis to trade the Asian, American, and cryptocurrency markets.


