Prices Forecast: Technical Analysis
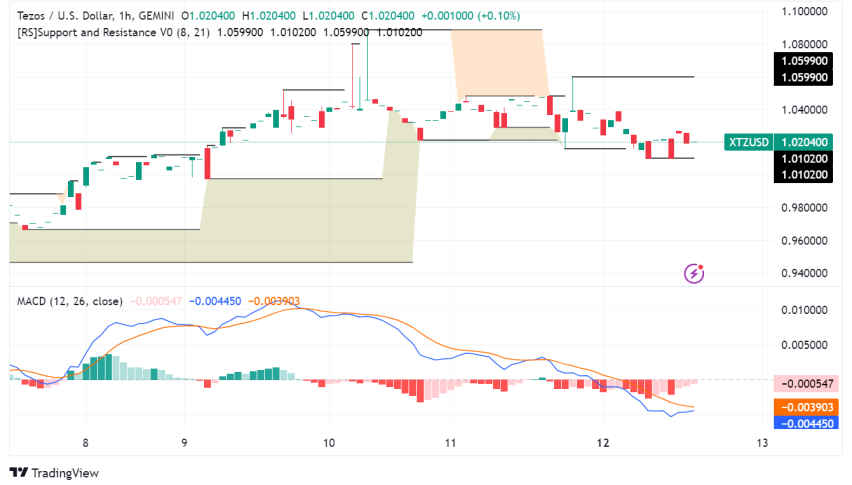
For the daily forecast, Tezos is expected to close around $0.62, with a potential range between $0.61 and $0.63. On a weekly basis, the closing price is projected to be approximately $0.63, with a range from $0.61 to $0.64. The RSI at 55.9355 suggests a neutral to slightly bullish momentum, indicating potential upward movement. The ATR of 0.0288 reflects moderate volatility, which could lead to price fluctuations within the predicted range. The ADX at 16.1327 indicates a weak trend, suggesting that significant price movements are unlikely without external catalysts. The MACD line is slightly below the signal line, hinting at a potential bearish crossover, but the histogram shows decreasing negative momentum, which could support a stabilization or slight upward trend. Overall, the technical indicators suggest a cautious outlook with potential for minor gains.
Fundamental Overview and Analysis
Tezos has experienced a gradual decline in recent months, with the current price hovering around $0.62. This trend reflects broader market conditions and investor sentiment, which have been influenced by macroeconomic factors such as inflation and interest rates. The asset’s value is primarily driven by its technological advancements and adoption within the blockchain space. However, regulatory challenges and competition from other cryptocurrencies pose significant risks. Despite these challenges, Tezos offers opportunities for growth through its scalable and energy-efficient blockchain technology. The asset is currently perceived as fairly priced, given its potential for future adoption and the current market environment. Investors remain cautiously optimistic, balancing the potential for innovation against the risks of market volatility and regulatory scrutiny.
Outlook for Tezos
Looking ahead, Tezos is expected to navigate a challenging market environment, with potential for moderate growth. The asset’s price is likely to be influenced by macroeconomic conditions, including inflation and regulatory developments. In the short term (1 to 6 months), Tezos may experience slight upward movement, with prices stabilizing around current levels. Long-term forecasts (1 to 5 years) suggest potential growth driven by technological advancements and increased adoption. However, external factors such as geopolitical tensions or market crashes could significantly impact the asset’s trajectory. Investors should remain vigilant, monitoring market trends and regulatory changes that could affect Tezos’ performance.
Technical Analysis
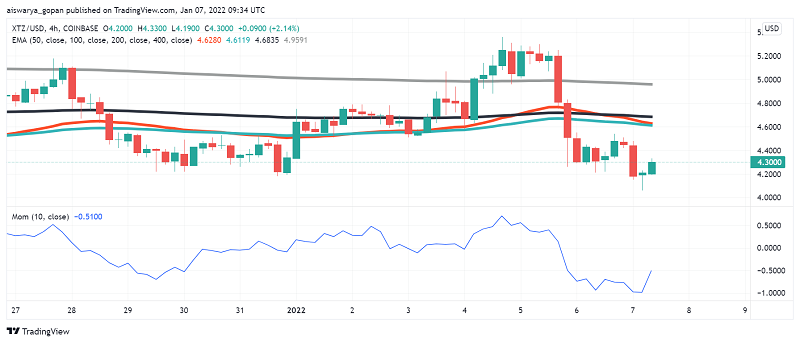
Current Price Overview: The current price of Tezos is $0.6205, slightly below the previous close of $0.6218. Over the last 24 hours, the price has shown minor fluctuations, reflecting moderate volatility. Support and Resistance Levels: Key support levels are at $0.62, $0.61, and $0.60, while resistance levels are at $0.63, $0.63, and $0.64. The pivot point is at $0.62, with the asset trading slightly below it, indicating potential bearish pressure. Technical Indicators Analysis: The RSI at 55.9355 suggests a neutral to slightly bullish trend. The ATR of 0.0288 indicates moderate volatility. The ADX at 16.1327 reflects a weak trend, suggesting limited directional movement. The 50-day SMA and 200-day EMA do not show a significant crossover, indicating a stable trend. Market Sentiment & Outlook: Sentiment is currently neutral, with price action near the pivot and RSI indicating a balanced market. The lack of a moving average crossover and moderate ATR suggest a stable outlook.
Forecasting Returns: $1,000 Across Market Conditions
The table below outlines potential returns on a $1,000 investment in Tezos under various market scenarios. In a Bullish Breakout scenario, a 10% price increase could raise the investment value to approximately $1,100. In a Sideways Range scenario, with a 0% change, the investment remains at $1,000. In a Bearish Dip scenario, a 10% decrease could reduce the investment to around $900. These scenarios highlight the importance of market conditions in determining investment outcomes. Investors should consider their risk tolerance and market outlook when deciding to invest in Tezos. Practical steps include monitoring market trends, setting stop-loss orders, and diversifying investments to mitigate risks.
| Scenario | Price Change | Value After 1 Month |
|---|---|---|
| Bullish Breakout | +10% to ~$0.6825 | ~$1,100 |
| Sideways Range | 0% to ~$0.6205 | ~$1,000 |
| Bearish Dip | -10% to ~$0.5585 | ~$900 |
FAQs
What are the predicted price forecasts for the asset?
The daily closing price for Tezos is predicted to be around $0.62, with a range between $0.61 and $0.63. The weekly forecast suggests a closing price of approximately $0.63, with a range from $0.61 to $0.64.
What are the key support and resistance levels for the asset?
Tezos has key support levels at $0.62, $0.61, and $0.60. Resistance levels are identified at $0.63, $0.63, and $0.64. The pivot point is at $0.62, with the asset currently trading slightly below it.
Disclaimer
In conclusion, while the analysis provides a structured outlook on the asset’s potential price movements, it is essential to remember that financial markets are inherently unpredictable. Conducting thorough research and staying informed about market trends and economic indicators is crucial for making informed investment decisions.