Oil Reversing at the Indicator we Highlighted Yesterday
Yesterday my colleague Arslan who covers commodities was off for the Eid Mubarak day so I had to cover them. By the way, happy Eid Mubarak..

Yesterday my colleague Arslan who covers commodities was off for the Eid holiday so I had to cover them. By the way, Eid Mubarak to all who celebrate it. I posted an article about the bullish reverse in WTI Oil yesterday. In fact, I saw that move as a retrace of the major bearish trend that began a month ago.
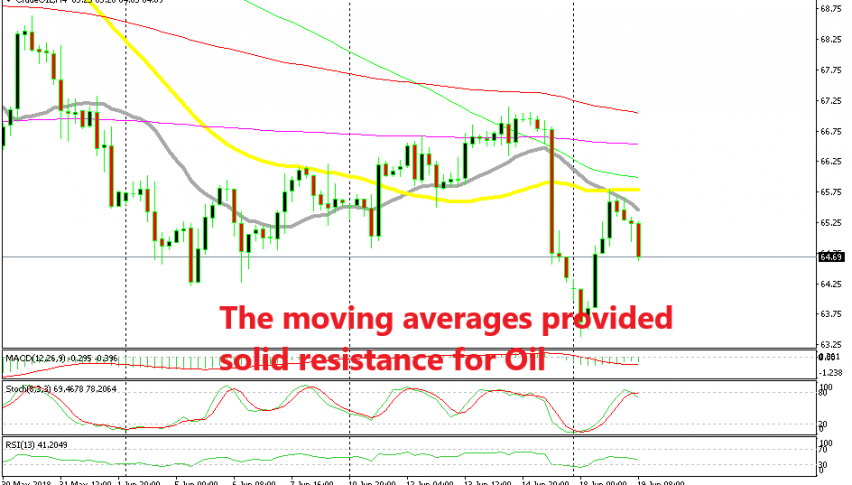
So, crude oil was heading up and I highlighted a particular indicator which might provide resistance to Oil. Well, that indicator worked perfectly today. The price climbed up until it touched that indicator and it started to reverse back down.
That indicator is the 50 SMA (yellow) on the H4 chart. Although, another indicator came to help the 50 SMA. That indicator is the 20 SMA (grey). The 20 SMA has provided support on the way up and now it has turned into resistance.
The fundamentals have also helped the Oil sellers as well. Iran, Venezuela and Algeria oppose increasing the oil output by the OPEC+ countries. Russia and Saudi Arabia want to hike the output, but it seems that there won’t be an agreement on that.
This should be bullish for Oil, but the problem is that Russia, Saudi Arabia and other OPEC+ countries might go on and increase Oil production on their own. So, crude oil has reversed and it has resumed the bearish trend. The reverse happened during the night so we missed it, although it was a really good trade idea. I hope someone took that trade.
- Check out our free forex signals
- Follow the top economic events on FX Leaders economic calendar
- Trade better, discover more Forex Trading Strategies
- Open a FREE Trading Account


