Gold Nears $3,500 as Iran-Israel Conflict Spurs 4-Day Rally—Is a Reversal Next?
Gold (XAU/USD) rose for a 4th day in a row, hitting a near 2 month high on Monday as the escalating conflict between Israel and Iran spooked
Quick overview
- Gold (XAU/USD) has risen for four consecutive days, reaching a near two-month high due to escalating tensions between Israel and Iran.
- The conflict has increased demand for safe-haven assets, pushing gold prices above $3,400 for the first time since April.
- Technical indicators suggest potential exhaustion in gold's upward momentum, with resistance tested at $3,451 and support at $3,379.
- Traders are advised to consider a short opportunity below $3,420, targeting $3,379 and $3,348, with a stop-loss above $3,451.
Gold (XAU/USD) rose for a 4th day in a row, hitting a near 2 month high on Monday as the escalating conflict between Israel and Iran spooked markets. Investors are flocking to safe-haven assets like gold, pushing the metal above $3,400 for the first time since April.
“This is a rising joint geopolitical risk premium,” said Kelvin Wong, Senior Market Analyst at OANDA, as the conflict is increasing demand for security assets.
Israel and Iran exchanged strikes over the weekend, resulting in civilian casualties and fears of a wider regional war. US President Donald Trump said he hopes for a diplomatic solution but “sometimes countries have to fight it out first” leaving markets on edge.
Meanwhile, traders are also looking at monetary policy decisions this week, especially from the US Federal Reserve. The Fed is expected to keep rates steady on Wednesday but futures are pricing in 2 rate cuts by year end, possibly as soon as September given the cooling inflation data.
Technicals Flash Warning as Gold Tests Resistance
From a technical perspective, gold tested and rejected the resistance at $3,451, a level that has held since May. Despite the bullish ascending triangle supported by higher lows, the recent price action is showing signs of exhaustion.
A spinning top candle at resistance followed by a bearish candle signals uncertainty, while the Relative Strength Index (RSI) is diverging – not confirming new highs with price. Currently at 64, RSI is curling down from overbought levels, indicating waning momentum.
Support is at $3,379, the trendline from June 6. A break below this level could trigger a bigger pullback to $3,348.
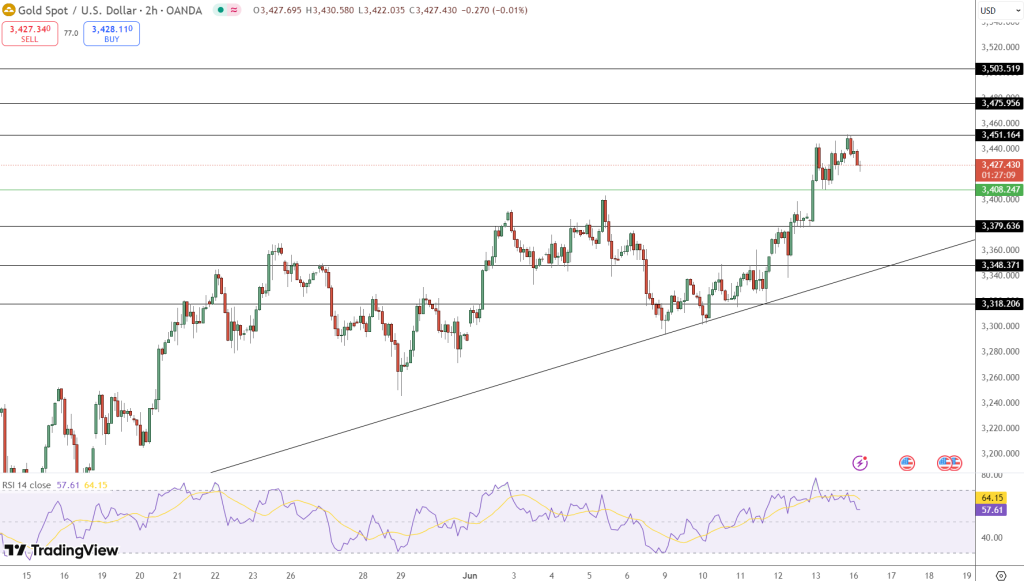
Trade Setup: Short Opportunity Below $3,420
For traders: this may be a short opportunity on the daily chart.
- Entry: Sell below $3,420 (confirmation candle required)
- Targets: First at $3,379, second at $3,348
- Stop-Loss: Above $3,451
This setup uses trendline support, bearish RSI divergence and candlestick confirmation – a good combination for swing traders looking for a short term correction.
- Check out our free forex signals
- Follow the top economic events on FX Leaders economic calendar
- Trade better, discover more Forex Trading Strategies
- Open a FREE Trading Account